README
SATNET
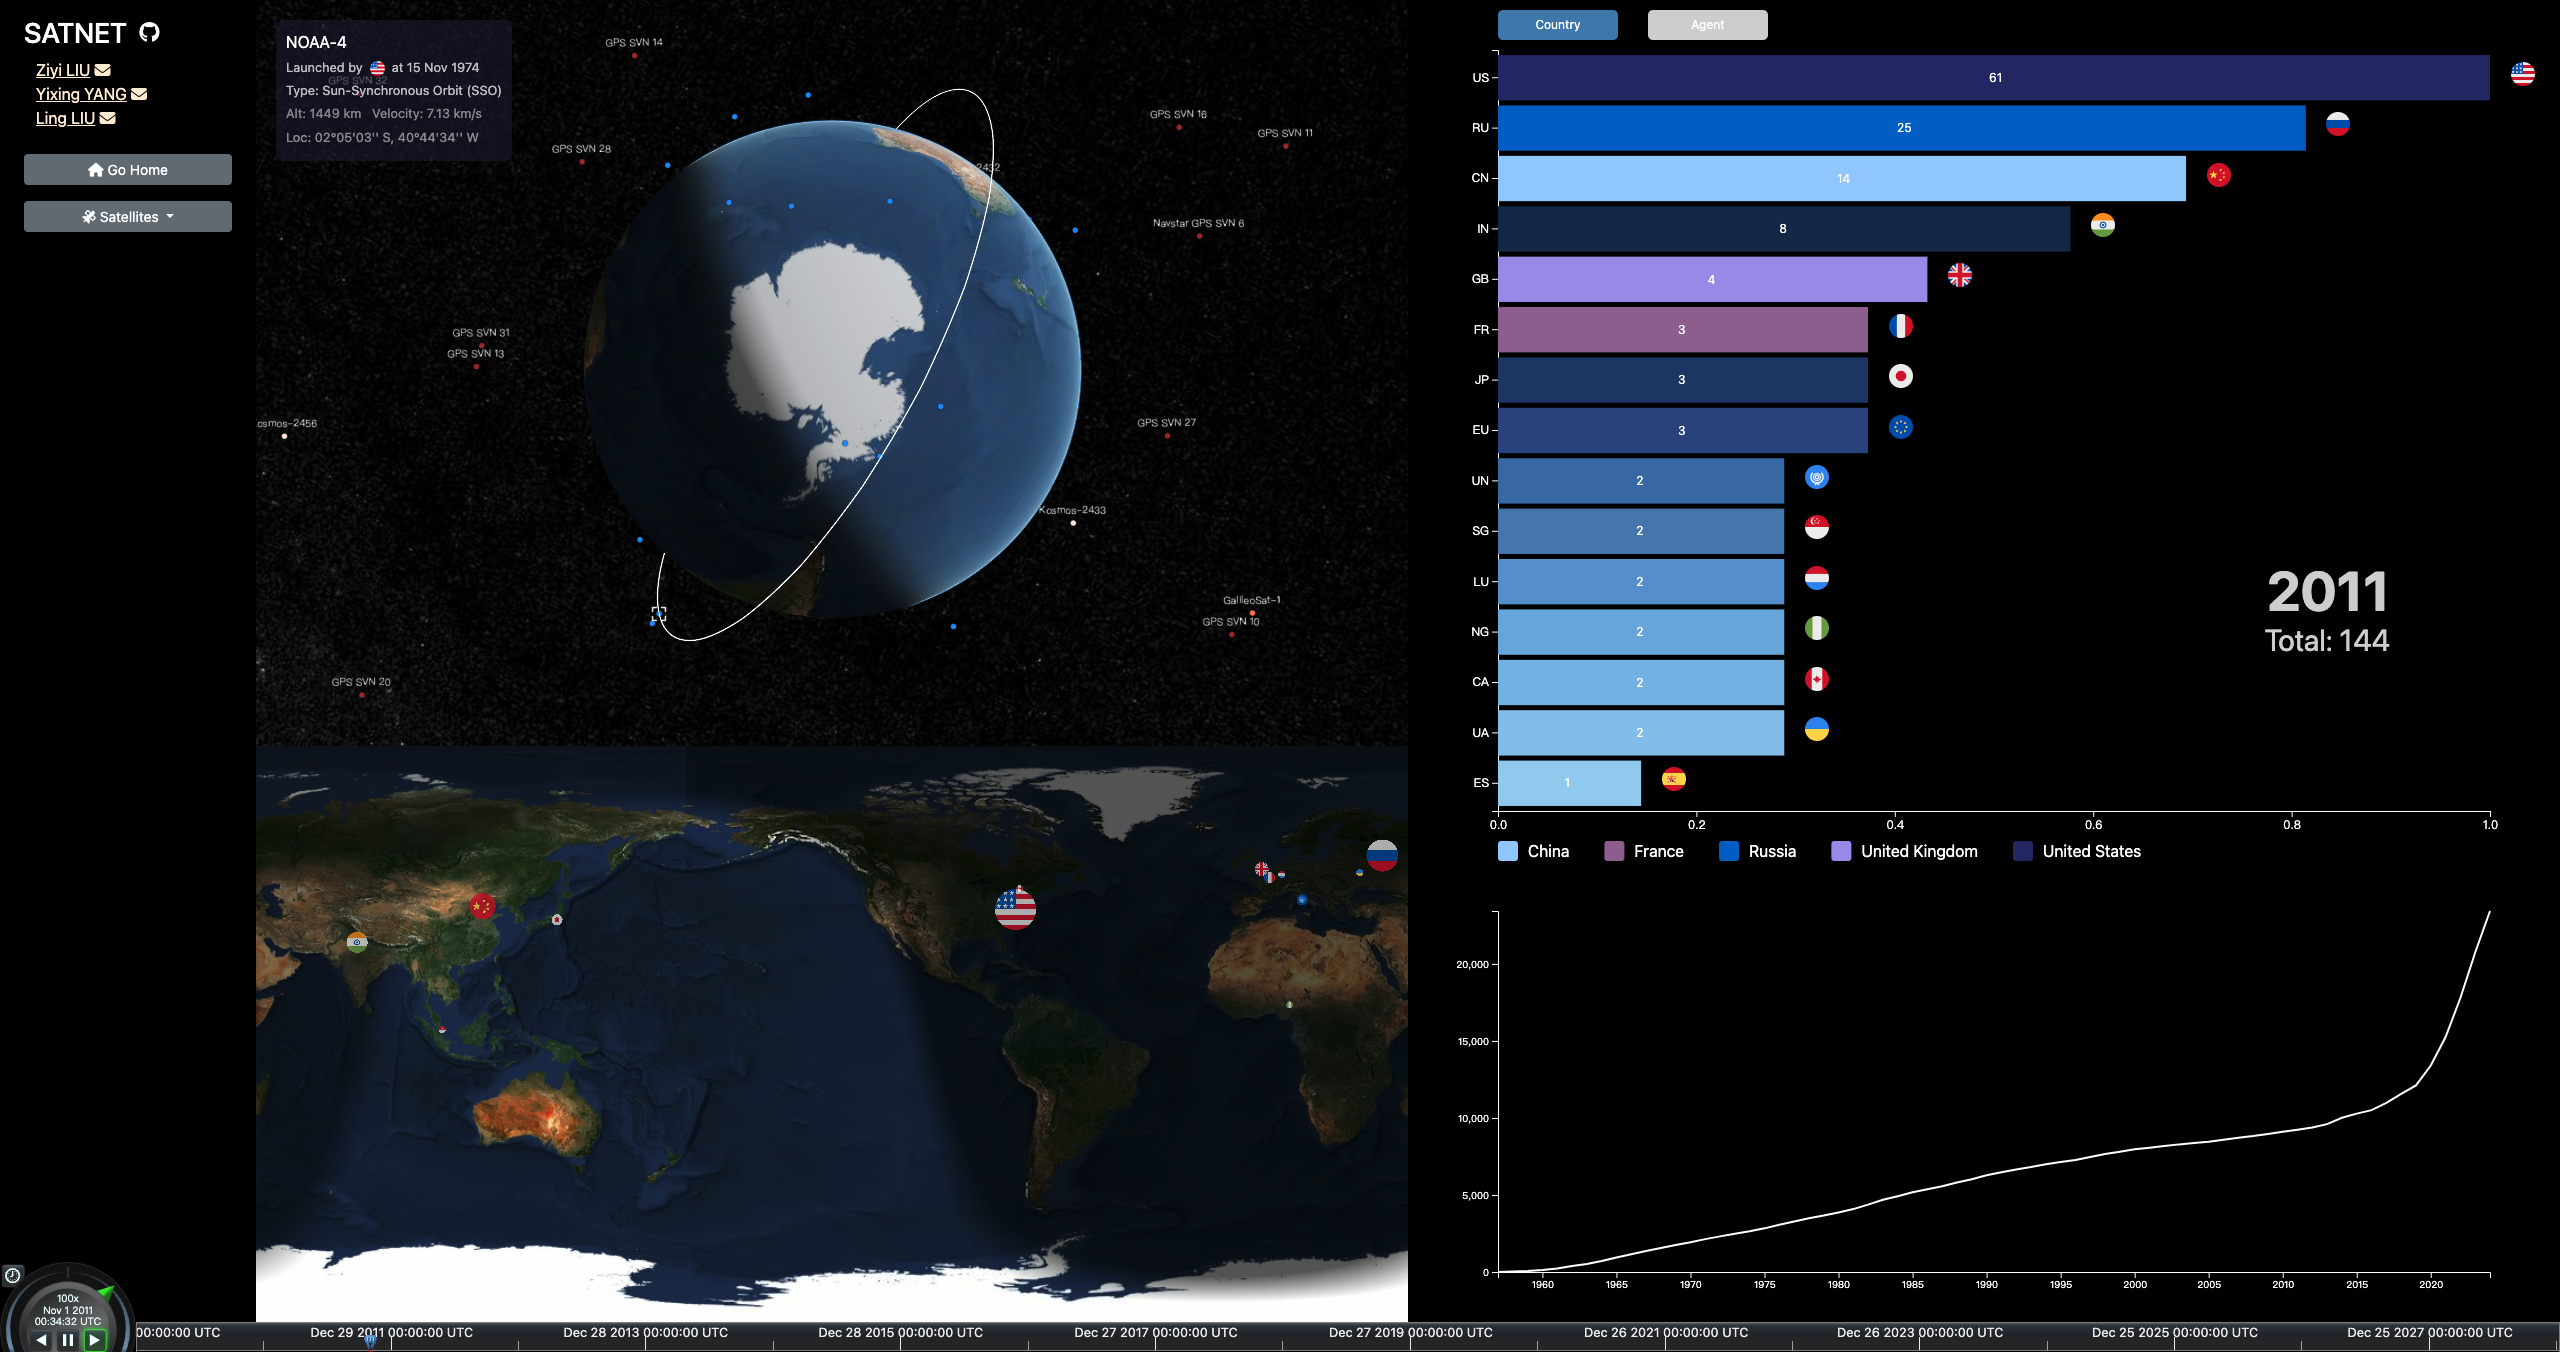
3D satellite plotting application with the ability to highlight specific satellites and display detailed information.
Run the Project
Installation Dependencies
npm install
Scripts Supported by npm
-
start: Starts the Vite development server
npm startornpm run dev. -
build: Builds the project for production
npm run build. -
serve: Serves the built project for preview
npm run serve.After running
npm run build, the project will be built in thedistdirectory. You can preview the built project by runningnpm run serve. -
After script running, the webpage can be shown in the http://localhost:4170/.
Visualization
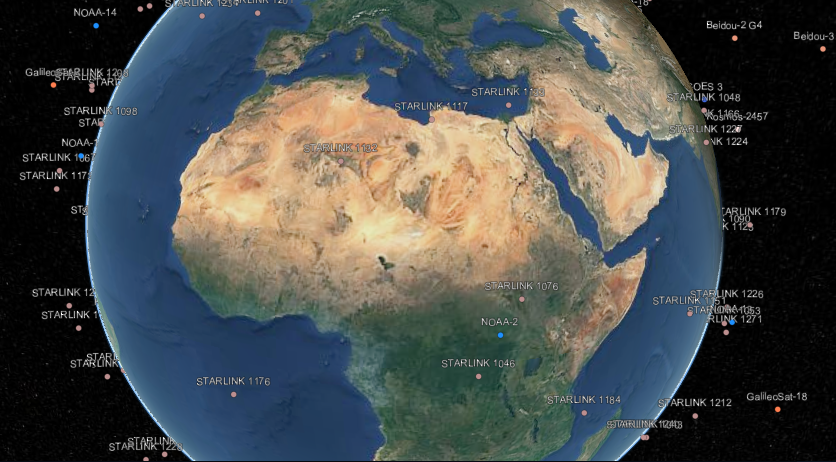
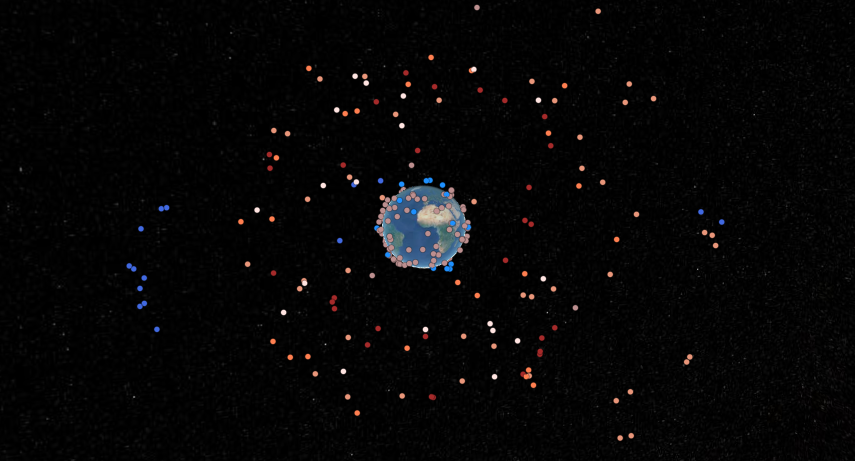
3D Globe
3D Globe Zoom Levels
 (a) Zoomed-in View |
 (b) Zoomed-out View |
Satellite Orbits with Information Card
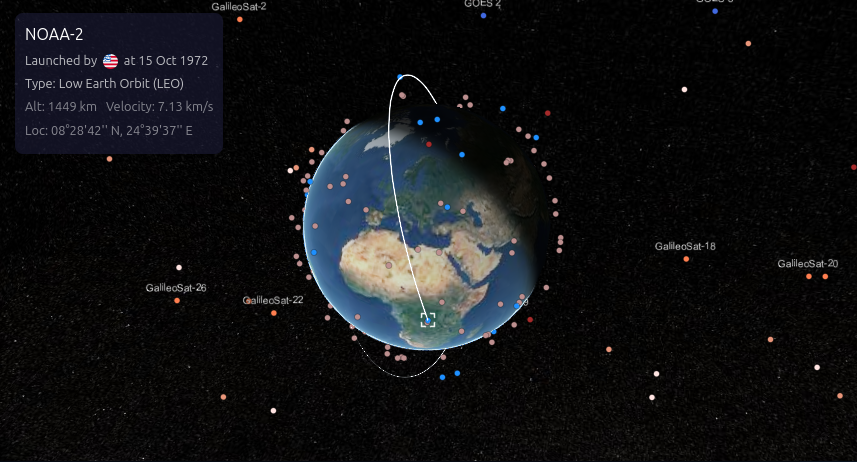 (a) Low Earth Orbit (LEO) |
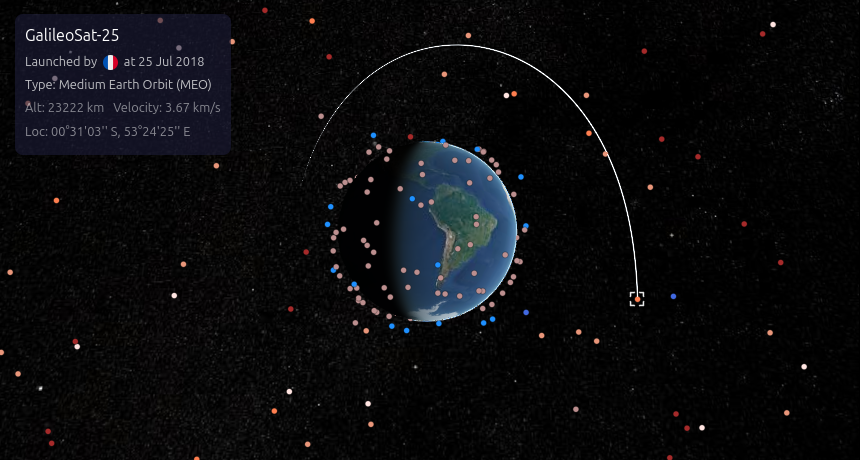 (b) Medium Earth Orbit (MEO) |
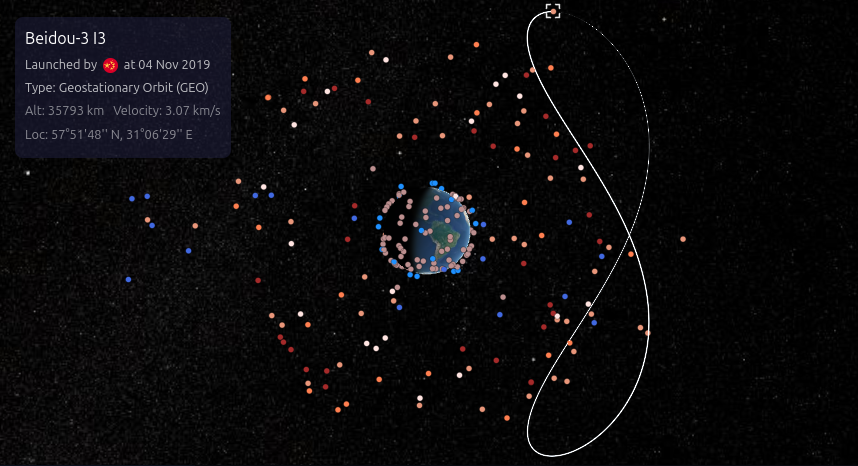 (c) Geostationary Orbit (GEO) |
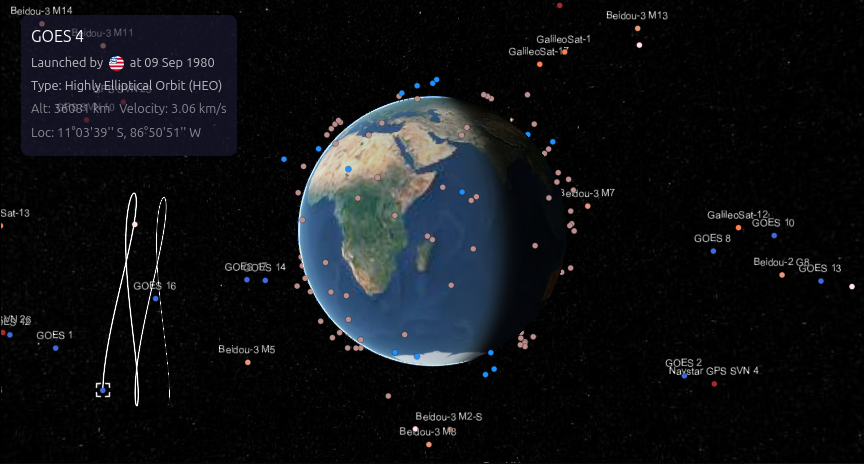 (d) High Orbit (HEO) |
2D Map
Satellite Launching Animation
The launch animation is driven by time and location on Earth. Once the launch time matches the Cesium global clock, the animation begins, and new entities are added to the 2D Cesium Viewer.
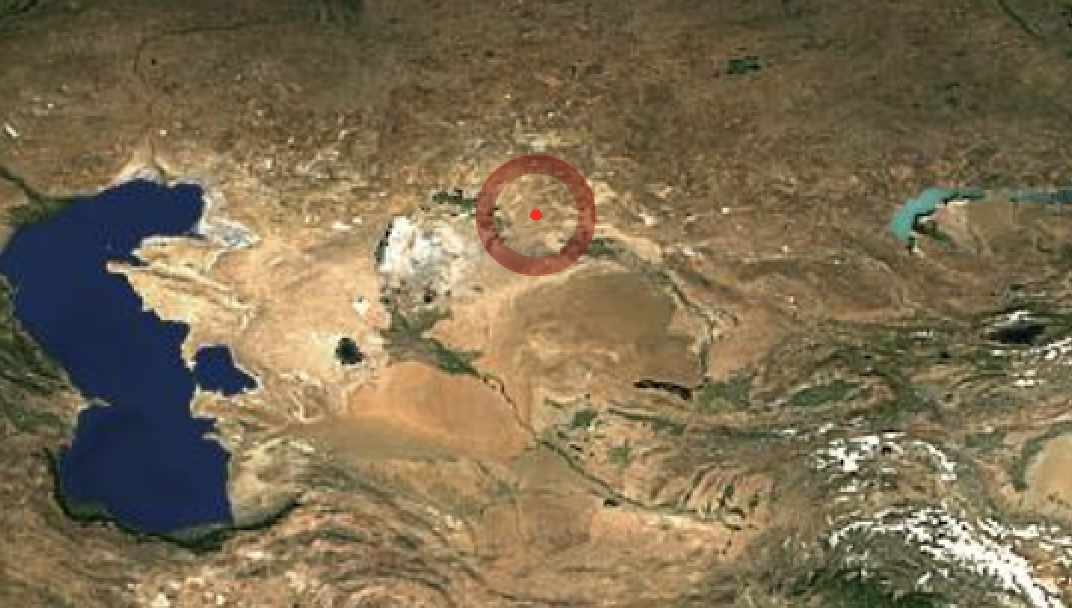
Country Circles
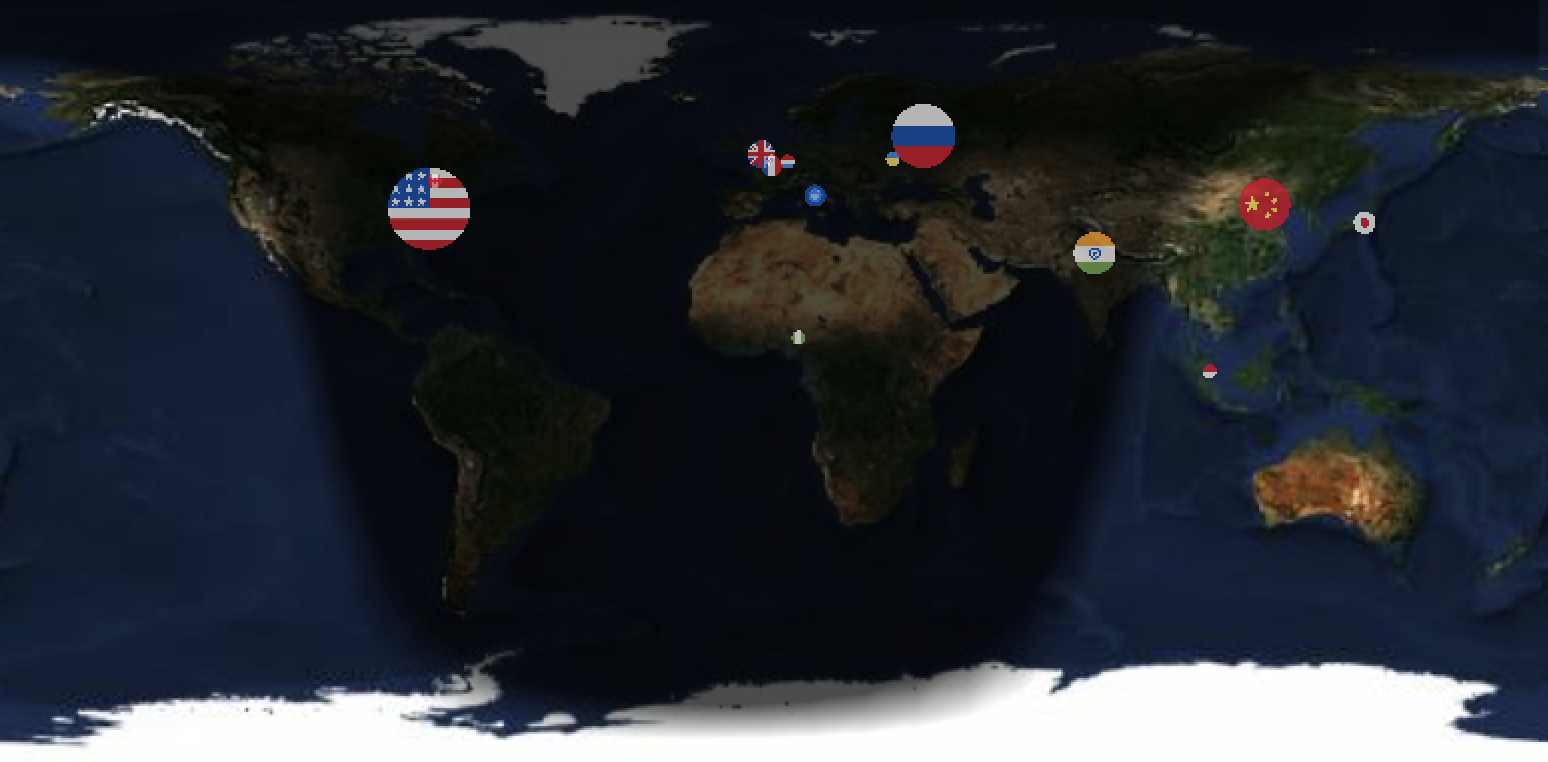
The size of the country circle represents the number of satellites launched in the previous year, with the circle's center placed at the geographical coordinates of each country's capital.
Barchart: Ranking Launches by Country and Agent
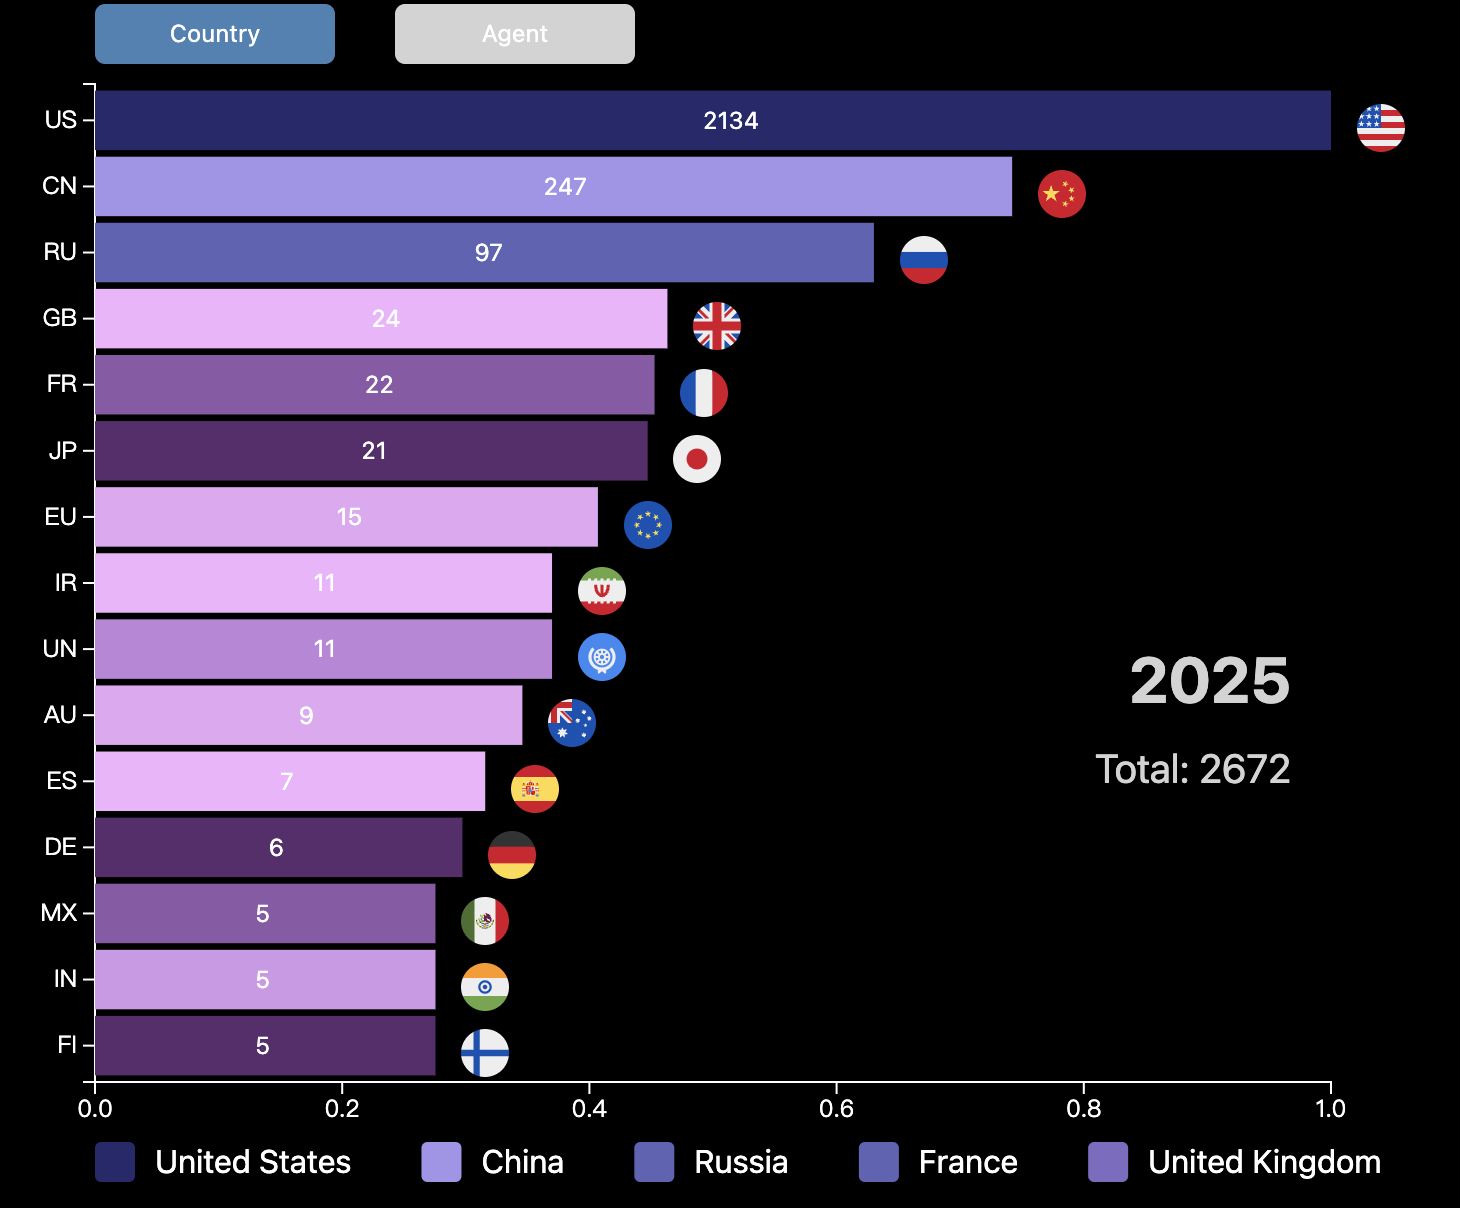 (a) Number of satellites launched by each country |
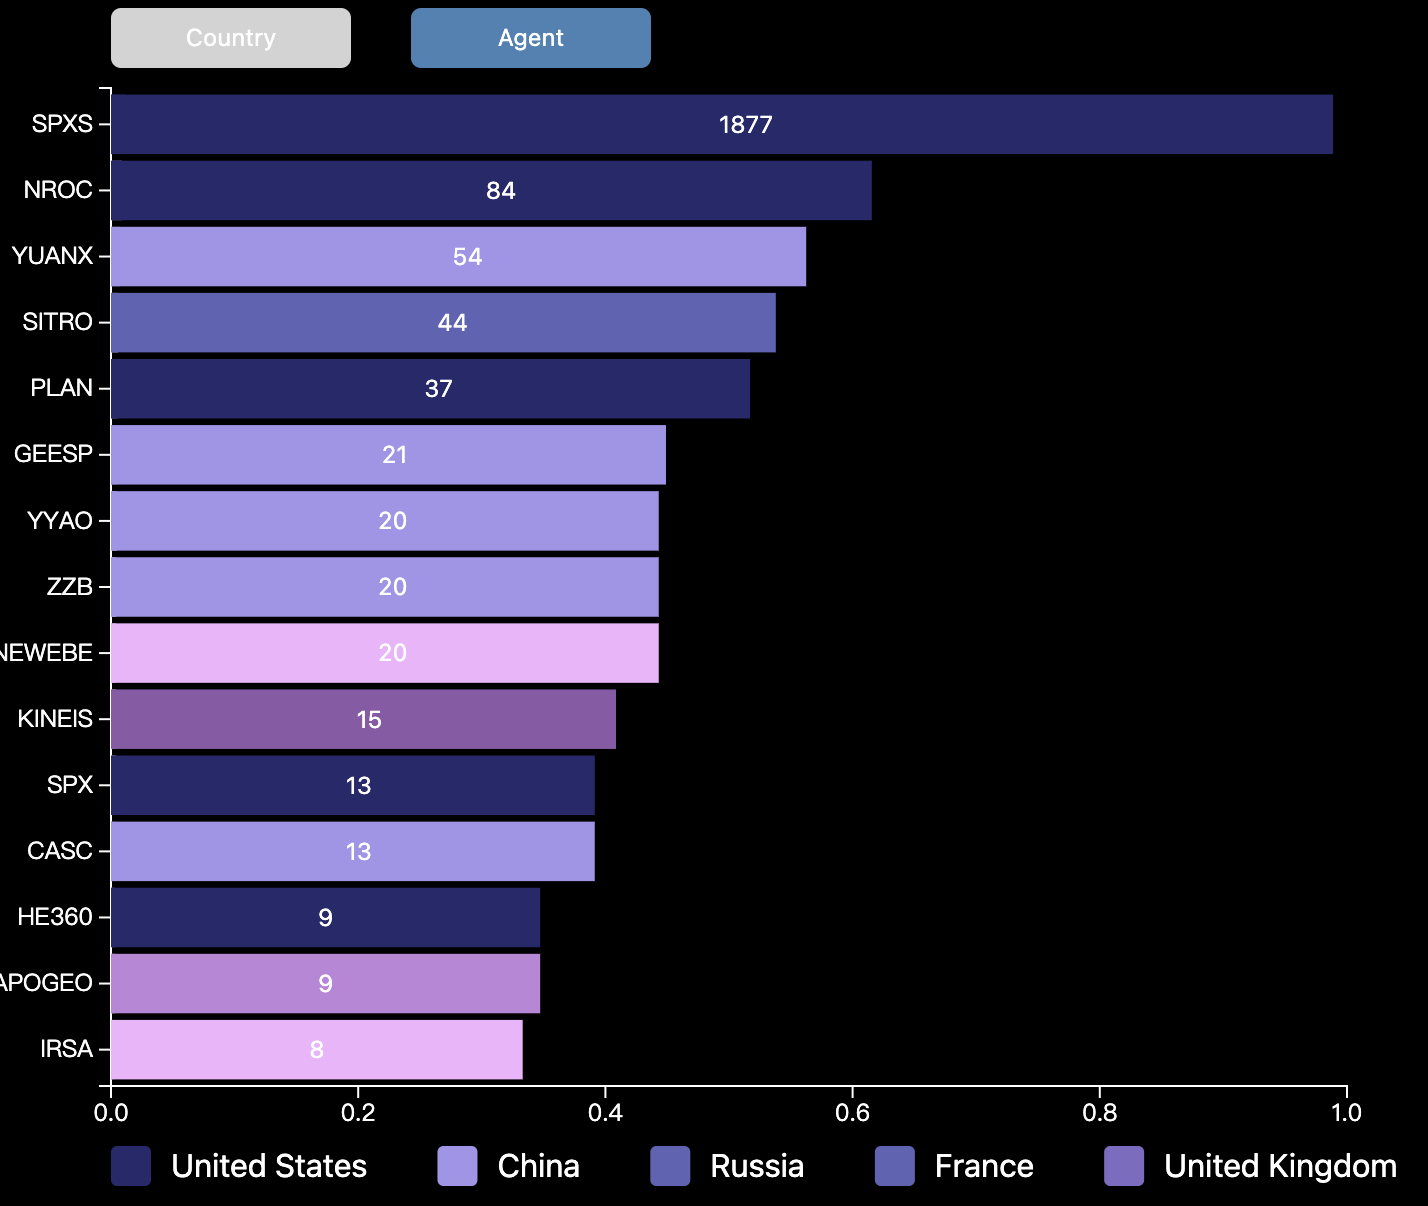 (b) Number of satellites launched by agents |
The barchart dynamically ranks satellite launches by country and agent on a yearly basis. Users can toggle between country and agent views and apply filters to selectively display or hide certain entities.
Websites for Reference
Examples / its Github repo
Others
- https://github.com/jeremysuh/3D-Satellite-Tracker
- https://github.com/andrewkihs/satellite-radio
- https://github.com/RuiZhang2Penn/Shinning
Data Souce
- https://celestrak.org/NORAD/elements/
- https://satdb.ethz.ch/ Processed 'celestrak' data APIs
- https://github.com/r-spacex/SpaceX-API/tree/master/docs/starlink/v4 might be official data
- https://planet4589.org/space/gcat/web/sites/index.html Launch sites