README
Satellite Visualizer
A satellite visualization panel plugin for Grafana based on CesiumJS.
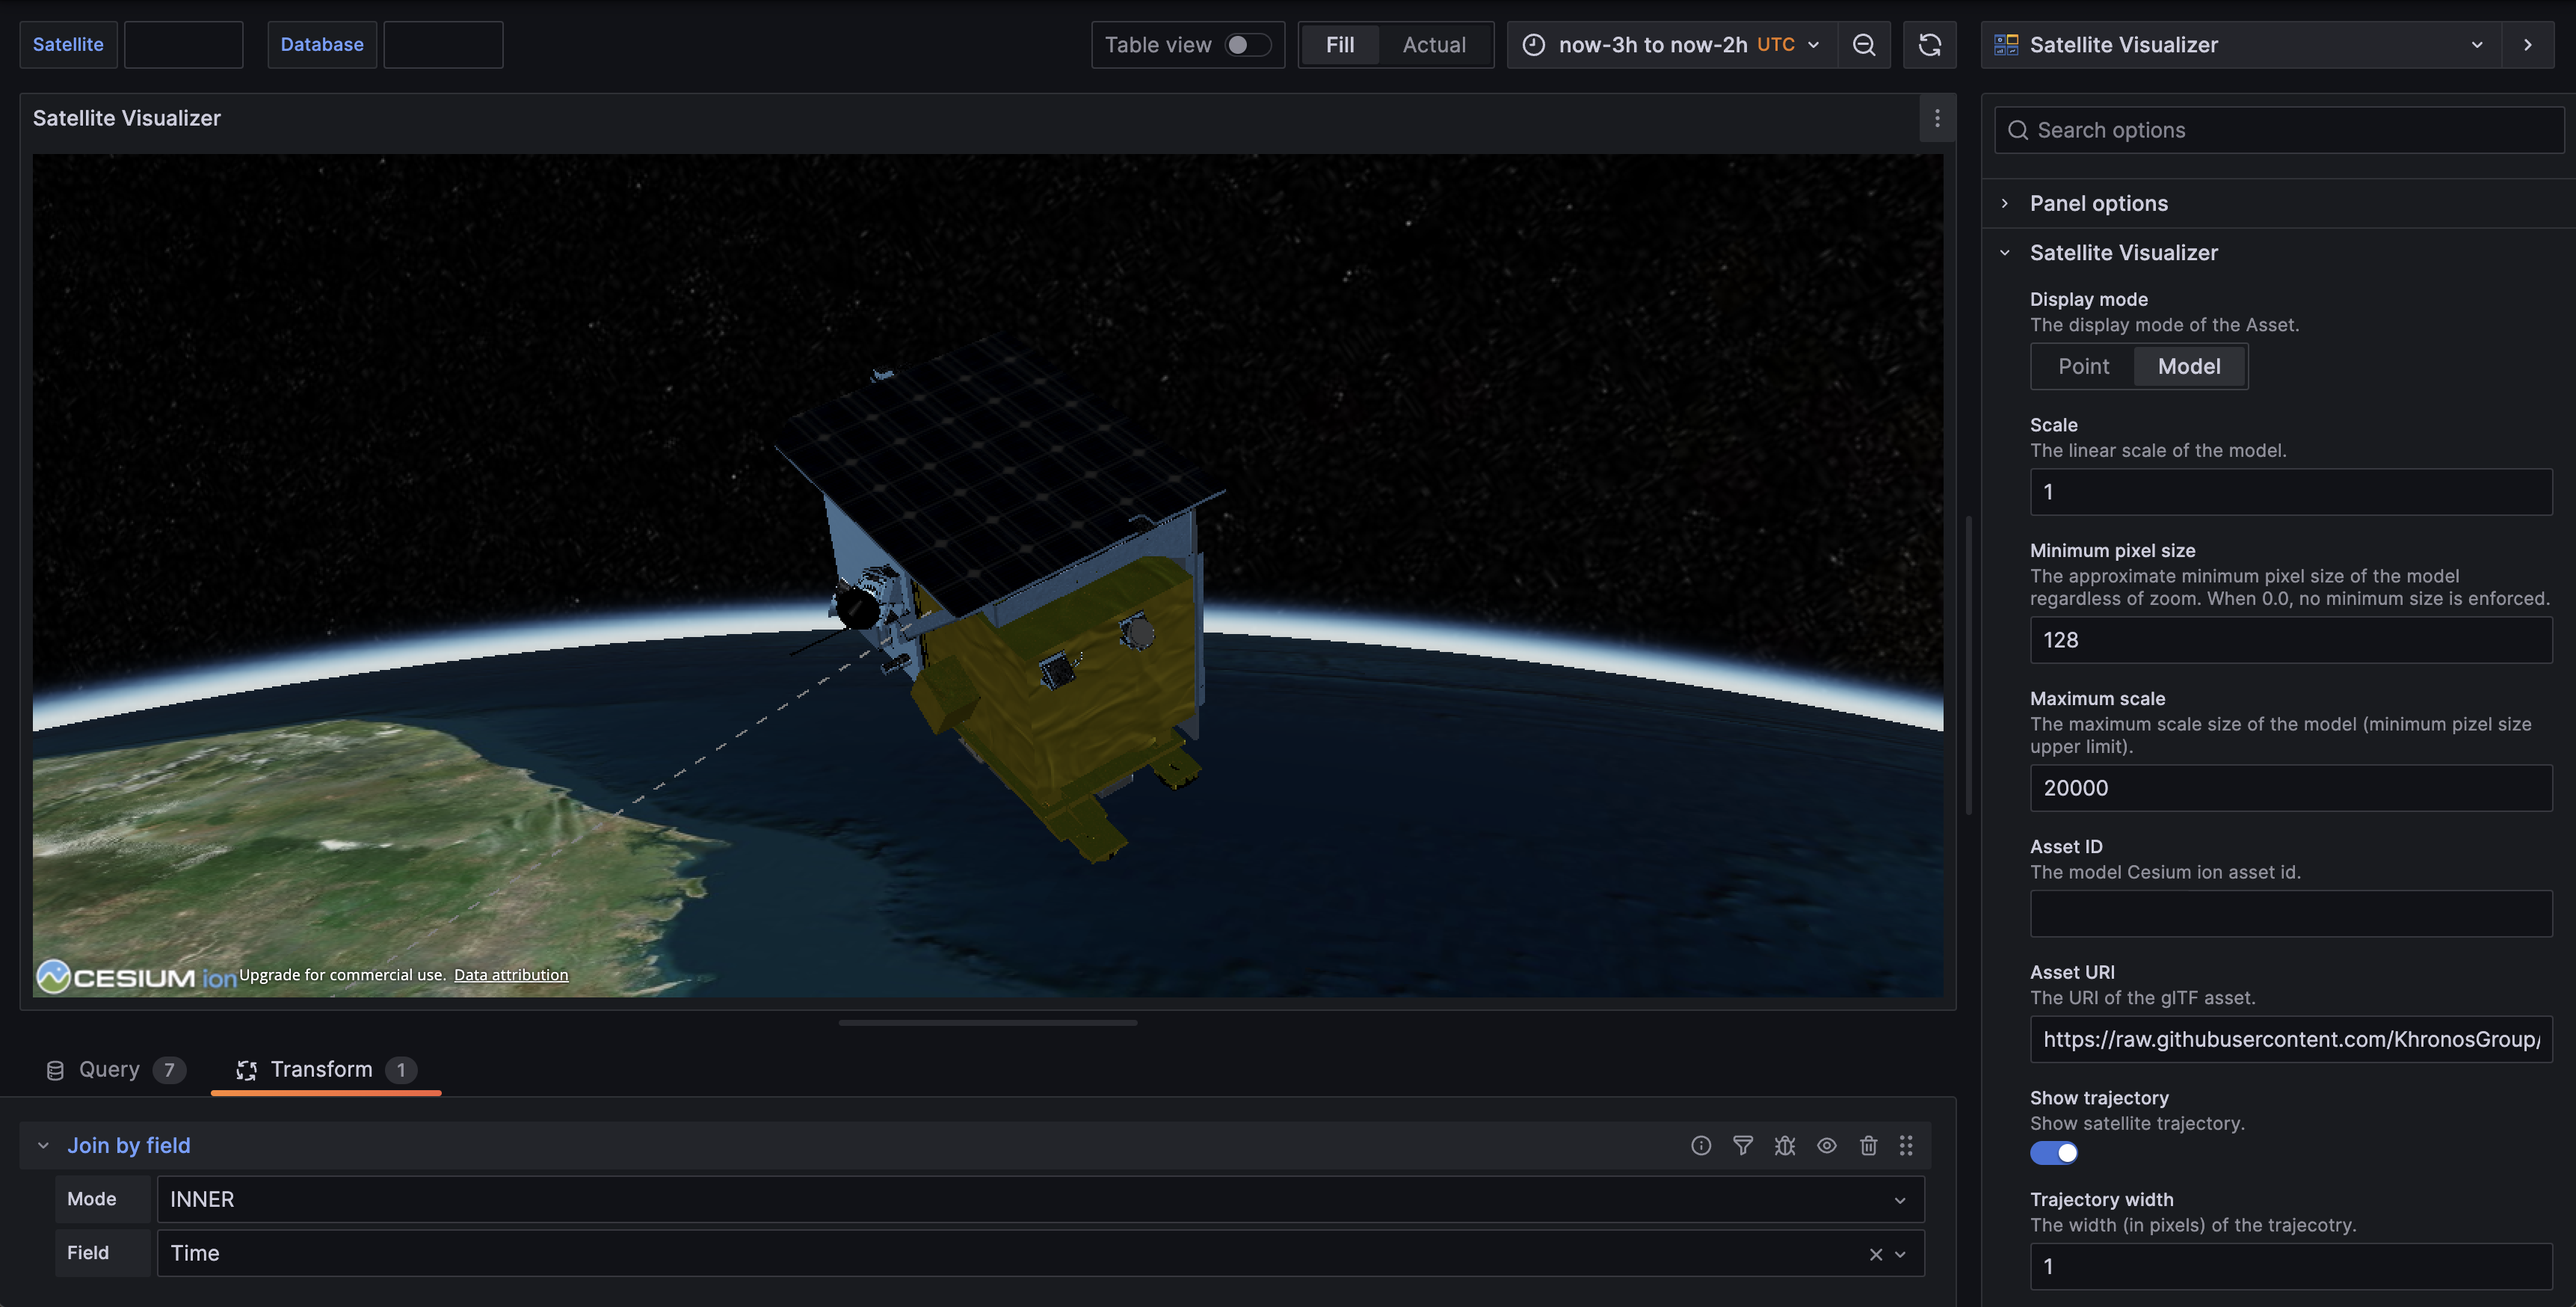
Settings
- Set
Access tokenwith a Cesium ion access token (security best practices). - (optional) Set
Asset IDwith ID of the glTF asset stored in Cesium ion.
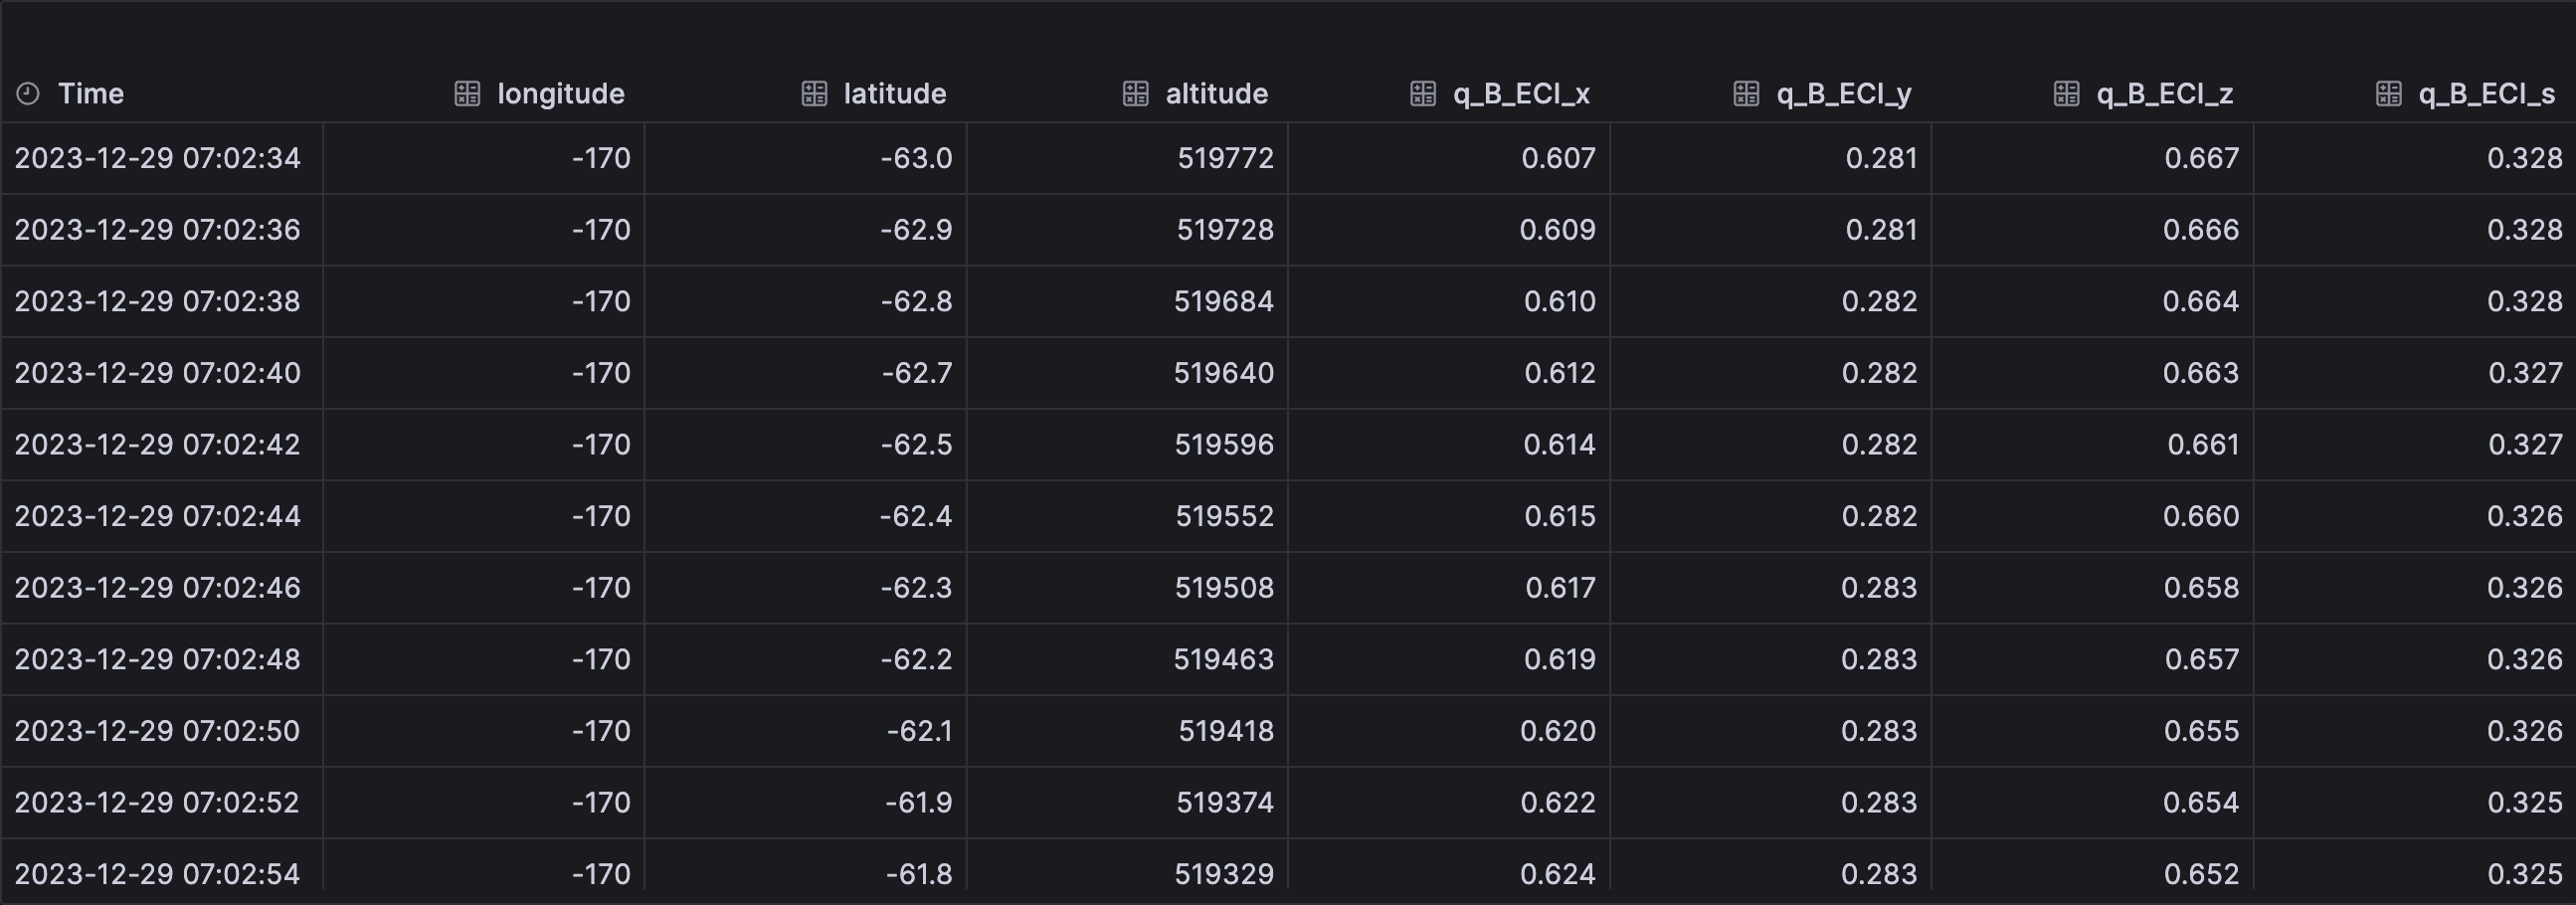
Data
This plugin needs a data series with 8 columns:
| Column # | Description |
|---|---|
| 1 | Time |
| 2 | Longitude (deg) / x_ECI (m) / x_ECEF (m) |
| 3 | Latitude (deg) / y_ECI (m) / y_ECEF (m) |
| 4 | Altitude (m) / z_ECI (m) / z_ECEF (m) |
| 5-8 | Orientation in inertial frame (x, y, z, s quaternion) |
Development
To start the development environment container:
make dev
Access the started Grafana instance at http://localhost:3000.
Release
To create a new release, run the following to bump the version in package.json:
npm version minor
Then push the tagged commit, to let the CI handle it:
git push origin main --follow-tags