README
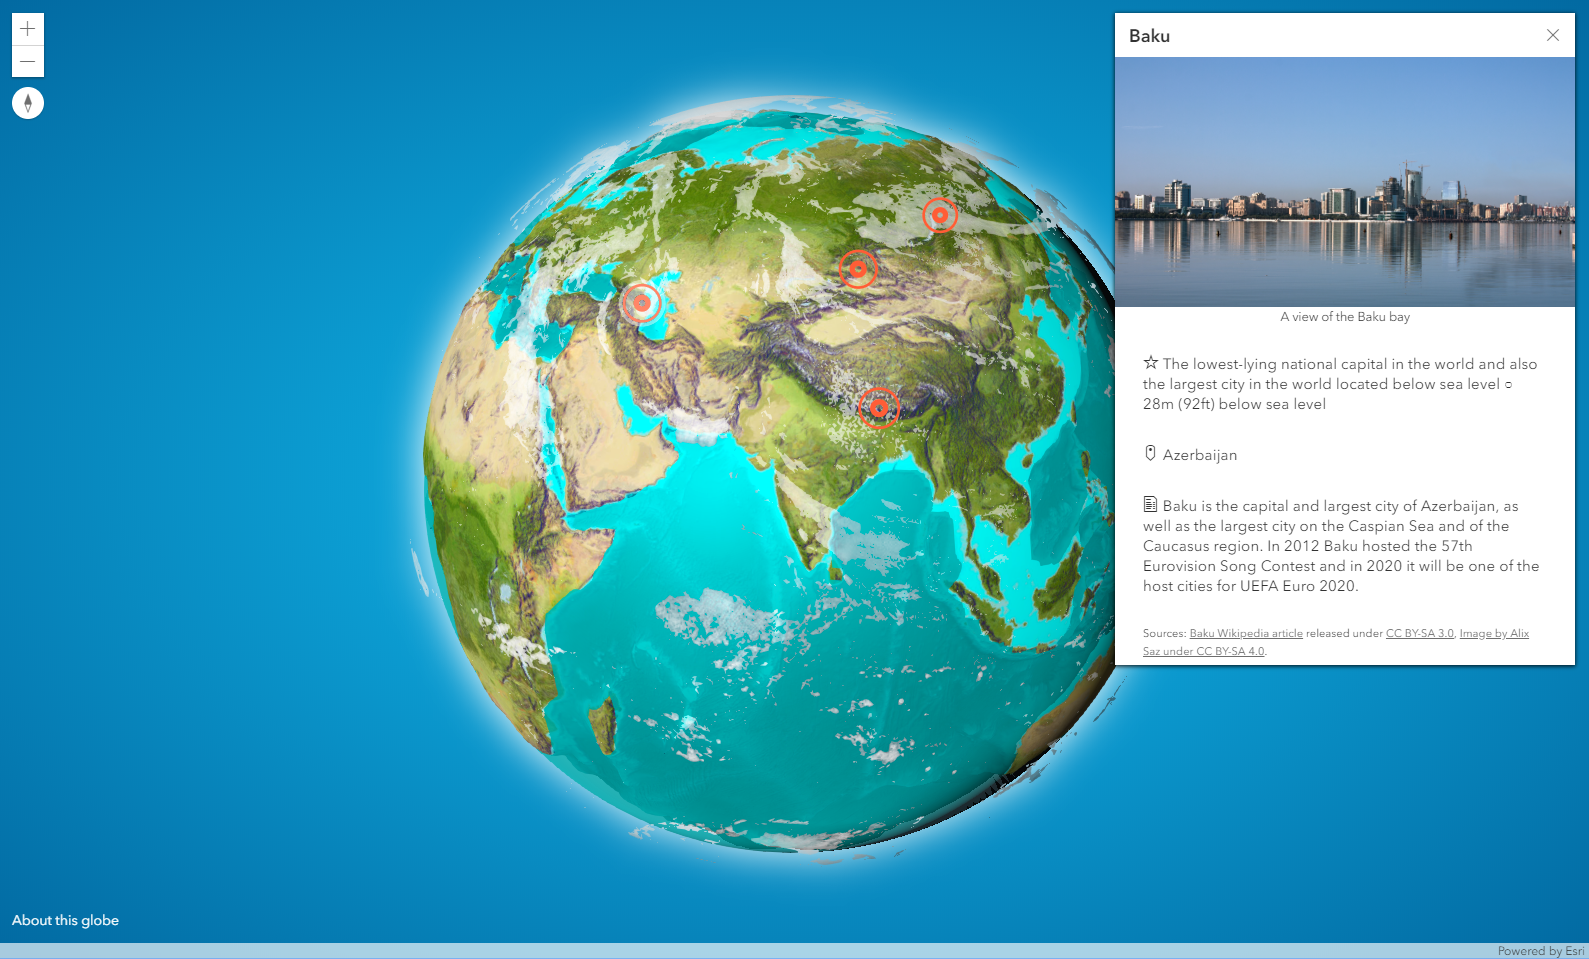
The globe of extremes
3D Globe created by John and Raluca after getting inspired by this awesome globe, this awesome globe and this awesome globe by Vizzuality. We used ArcGIS API for JavaScript to create the interactive globe and ArcGIS Pro to create the basemap. We used this Wikipedia article to get a list of extreme points on Earth and this cloud image from NASA Goddard Space Flight Center (image by Reto Stöckli) for the cloud layer.
I wrote about how to create the interactive globe in this blog post and John wrote about the Vibrant basemap that he created for Half-Earth project in this blog post.