这篇文章介绍下使用 Three.js 加载并可视化 GeoJSON(如地图)数据。主要演示了如何把地理多边形信息转成三维模型(挤压成高程形状 ExtrudeGeometry),并在每个区域顶部添加文字标签,实现一个基础的 3D 地图展示效果。
数据准备
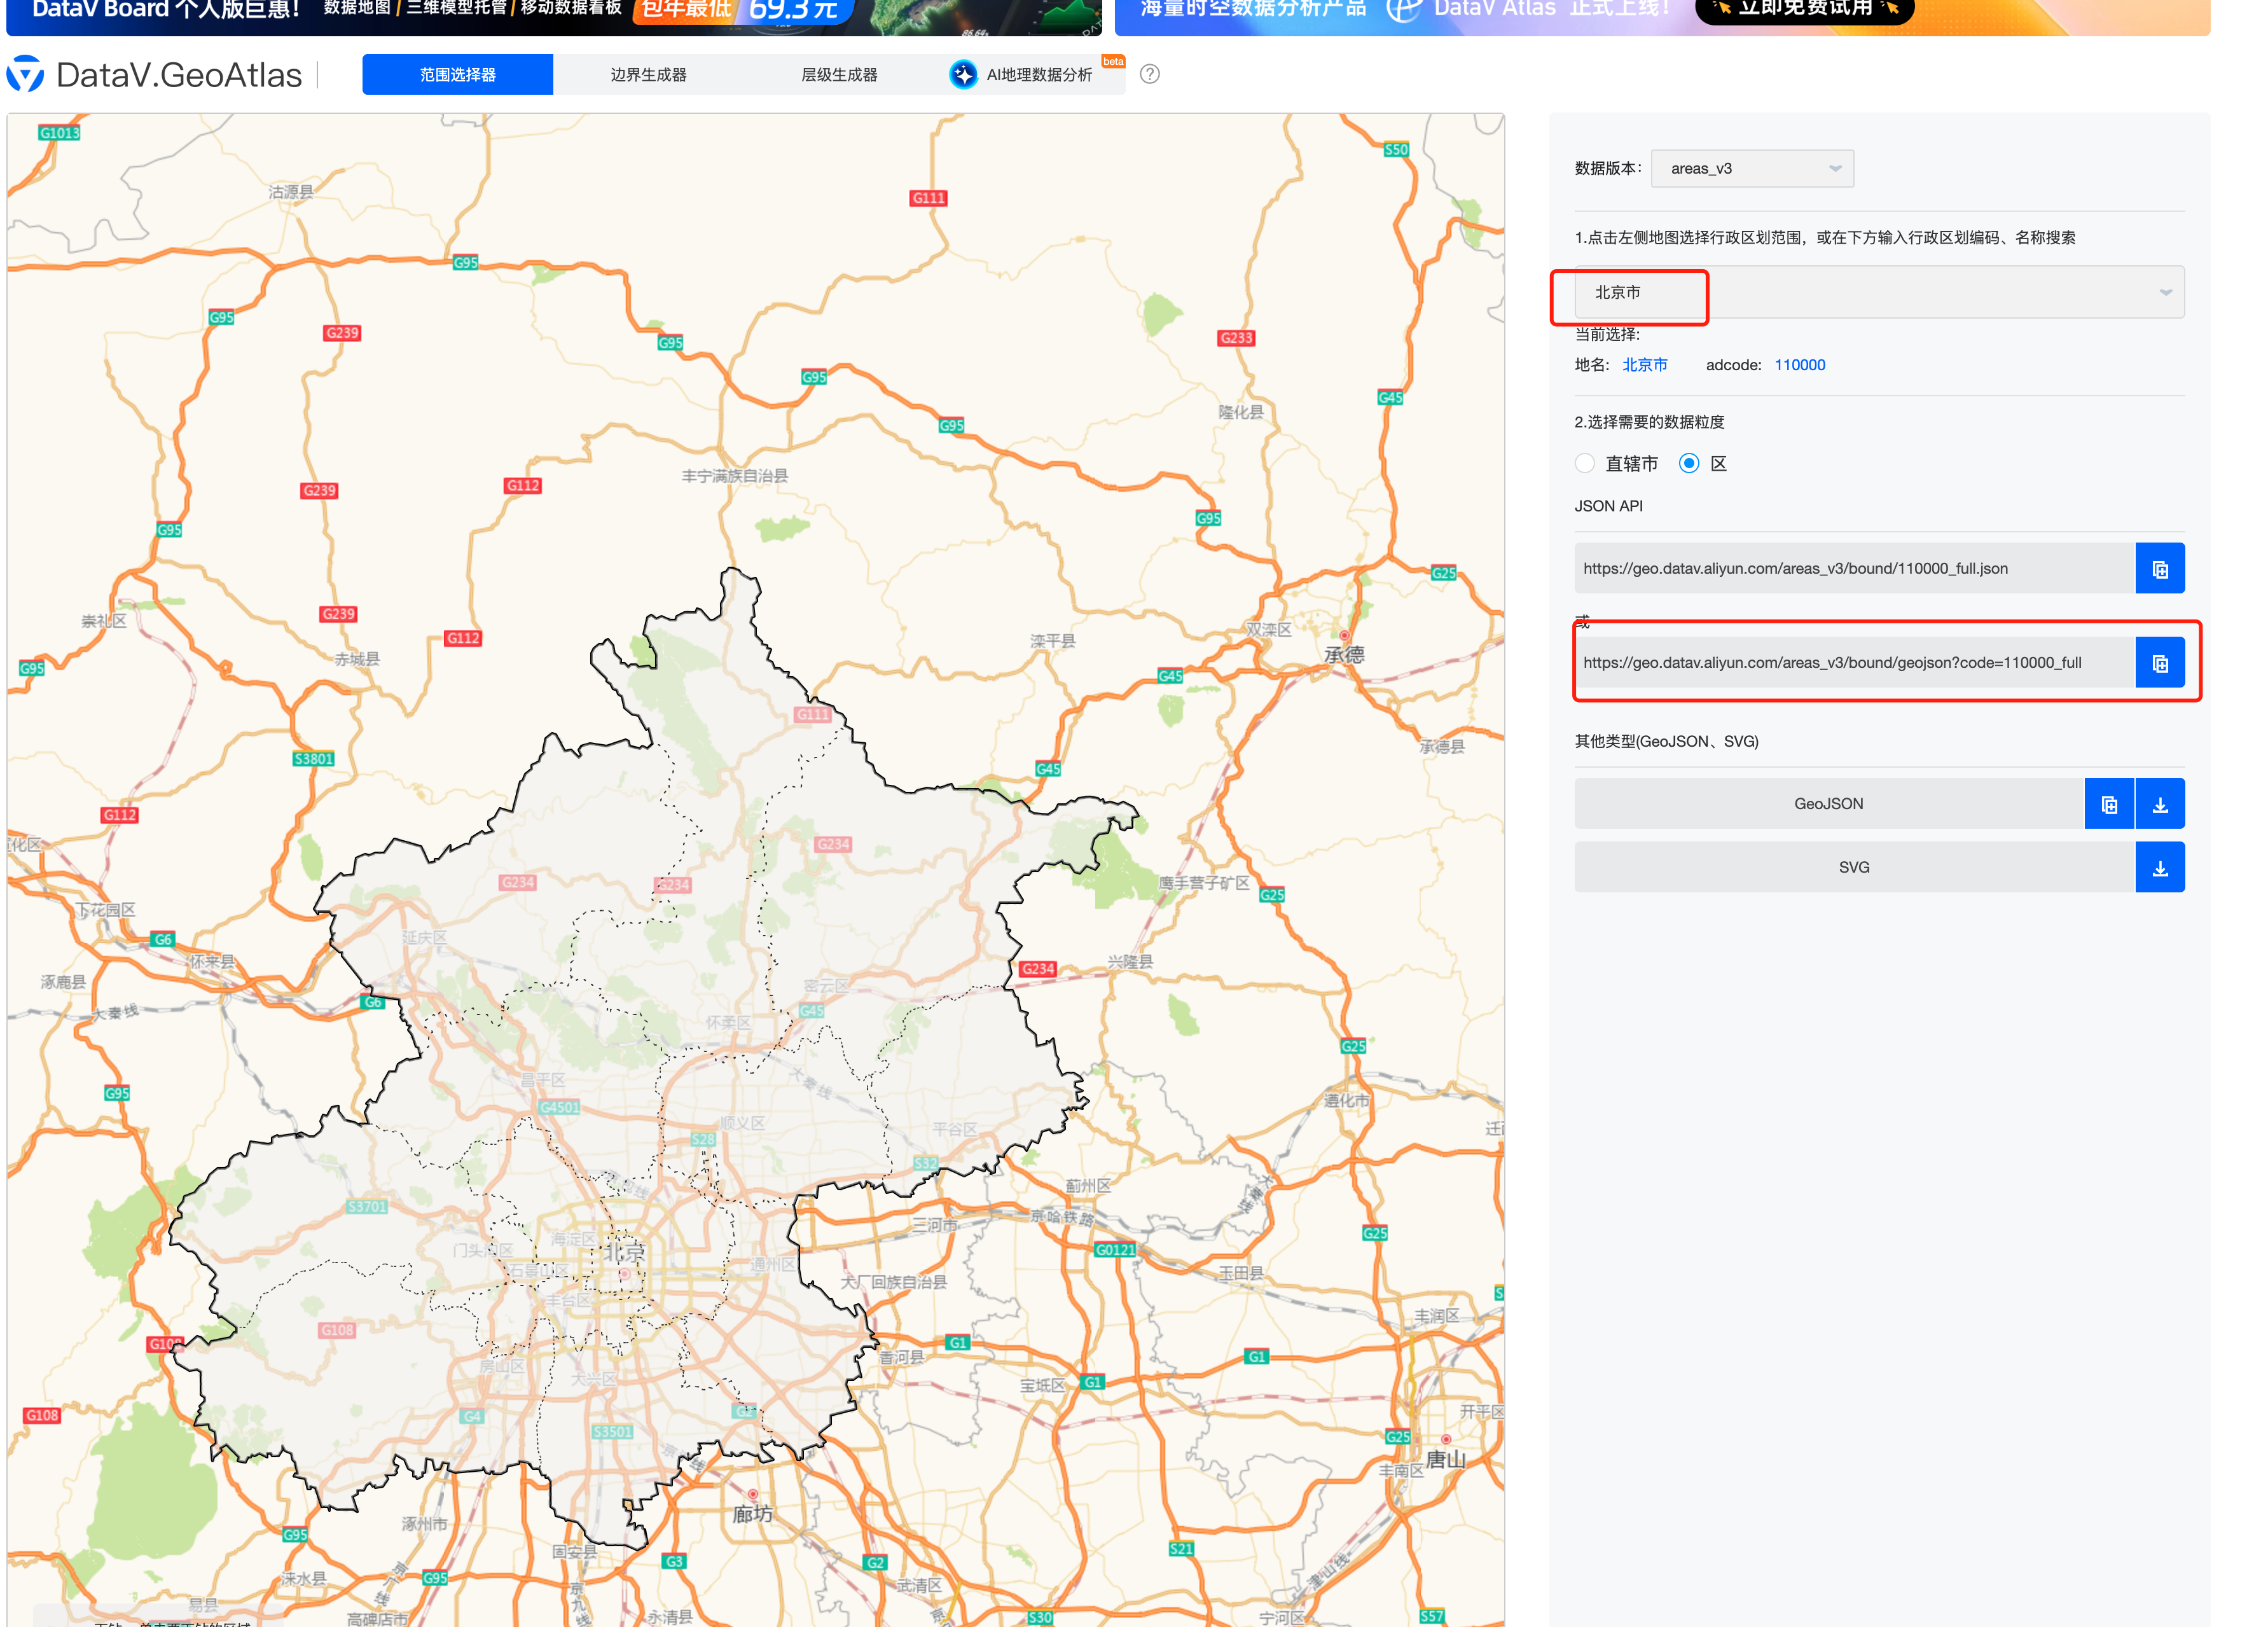
通过阿里云的数据可视化平台来生成一个 geojson 数据。
https://datav.aliyun.com/portal/school/atlas/area_selector (opens in a new tab)
这里我们选择北京的城区数据
实现步骤
初始化 Three.js 场景
在 main.js 中,我们首先要创建一个基本的 Three.js 场景 (Scene):
import * as THREE from "three";

const scene = new THREE.Scene();
// 设置场景背景色为深色(可根据需要修改)
scene.background = new THREE.Color(0x1a1a1a);
创建灯光照明
在 3D 场景中,为了更好地展示模型,我们需要添加适当的灯光。
// 添加环境光
const ambientLight = new THREE.AmbientLight(0xffffff, 0.4);
scene.add(ambientLight);

// 添加平行光
const directionalLight = new THREE.DirectionalLight(0xffffff, 1);
directionalLight.position.set(1, 1, 1);
scene.add(directionalLight);

// 添加一个点光源
const pointLight = new THREE.PointLight(0x00ffff, 0.5);
pointLight.position.set(0, 0, 30);
scene.add(pointLight);
这里我们添加了三种灯光用于展示不同的光照效果:
- 环境光(AmbientLight):为场景提供基础均匀的光照。
- 平行光(DirectionalLight):模拟太阳光,可以产生阴影效果。
- 点光(PointLight):从一点向所有方向发光,为场景增加可视化亮点。
设置相机与渲染器
设置相机
const camera = new THREE.PerspectiveCamera(
  45, // 视角(FOV)
  window.innerWidth / window.innerHeight, // 宽高比
  0.1, // 最近可视距离
  1000 // 最远可视距离
);
camera.position.set(0, -20, 30);
camera.lookAt(0, 0, 0);
使用 透视相机(PerspectiveCamera),并将其放置在 (0, -20, 30) 的位置,朝向原点。
设置渲染器
const renderer = new THREE.WebGLRenderer({ antialias: true });
renderer.setSize(window.innerWidth, window.innerHeight);
renderer.shadowMap.enabled = true;
document.body.appendChild(renderer.domElement);
antialias: true可以让图像变得更平滑。shadowMap.enabled = true开启阴影渲染(如果需要阴影时)。
加载 CSS2DRenderer(文字标签)
有些时候我们需要在场景中添加 HTML/DOM 文字标签,而不仅仅是纹理贴图的文字。这时候可以使用 CSS2DRenderer:
import { CSS2DRenderer, CSS2DObject } from "three/examples/jsm/renderers/CSS2DRenderer.js";

// 创建CSS2D渲染器
const labelRenderer = new CSS2DRenderer();
labelRenderer.setSize(window.innerWidth, window.innerHeight);
labelRenderer.domElement.style.position = "absolute";
labelRenderer.domElement.style.top = "0px";
labelRenderer.domElement.style.pointerEvents = "none";
document.body.appendChild(labelRenderer.domElement);CSS2DRenderer会在场景渲染的基础上再进行一次 2D DOM 渲染,从而可以将 HTML 元素贴在 3D 场景中的相对位置上。
添加 OrbitControls(轨道控制器)
为了方便查看 3D 模型,我们通常会加一个鼠标交互的控制器。在本示例中,使用的是 OrbitControls:
import { OrbitControls } from "three/examples/jsm/controls/OrbitControls";

const controls = new OrbitControls(camera, renderer.domElement);
这样就可以用鼠标旋转、缩放、平移整个 3D 场景。
编写关键函数
坐标转换函数
一般 GeoJSON 中的坐标是经纬度 (lon, lat),而 Three.js 的坐标是 x-y-z。在这里简单地做一个“平面投影”:
function convertCoordinates(coord, center) {
  const [lon, lat] = coord;
  const [centerLon, centerLat] = center;

  // 简单缩放,防止数值过大
  const scale = 15;
  const x = (lon - centerLon) * scale;
  const y = (lat - centerLat) * scale;

  return [x, y];
}- 这里把 (lon, lat) 转换成 (x, y)。
center表示地图中心的经纬度,用于“平移”到场景的原点附近。scale用于控制地图的大小,可以根据需求调整。
计算多边形中心点
为了给每个区域添加文字标签,我们需要知道多边形的中心位置。可以通过求所有点坐标的平均值来实现:
function calculatePolygonCenter(points) {
  if (points.length === 0) return { x: 0, y: 0 };

  let sumX = 0,
    sumY = 0;
  points.forEach((p) => {
    sumX += p.x;
    sumY += p.y;
  });

  return {
    x: sumX / points.length,
    y: sumY / points.length,
  };
}
创建文字标签
使用 CSS2DObject 来创建可随距离缩放的文字标签:
function createLabel(name, position) {
  const div = document.createElement("div");
  div.className = "label";
  div.textContent = name;
  div.style.color = "#00ffff";
  div.style.padding = "4px 8px";
  div.style.fontSize = "12px";
  div.style.backgroundColor = "rgba(0, 0, 0, 0.7)";
  div.style.borderRadius = "4px";
  div.style.border = "1px solid #00ffff";
  div.style.whiteSpace = "nowrap";
  div.style.pointerEvents = "none";
  div.style.textAlign = "center";
  div.style.transform = "translate(-50%, -50%)";
  div.style.position = "absolute";

  const label = new CSS2DObject(div);
  label.position.set(position.x, position.y, position.z);

  // 添加一个 update 函数,用于根据镜头远近来控制标签缩放
  label.update = function () {
    const distance = camera.position.distanceTo(new THREE.Vector3(position.x, position.y, position.z));
    // 距离越远,标签缩得越小,反之亦然
    const scale = Math.max(0.5, Math.min(1, 30 / distance));
    div.style.transform = `translate(-50%, -50%) scale(${scale})`;
  };

  return label;
}
创建挤压形状
GeoJSON 中的多边形可以用 THREE.Shape 定义,然后通过 ExtrudeGeometry 将其拉伸为三维立体。这里给它一个随机高度,或者根据某些业务数据设置:
function createExtrudedShape(points, height) {
  const shape = new THREE.Shape();
  points.forEach((point, i) => {
    if (i === 0) {
      shape.moveTo(point.x, point.y);
    } else {
      shape.lineTo(point.x, point.y);
    }
  });

  const extrudeSettings = {
    depth: height,
    bevelEnabled: true,
    bevelThickness: 0.3,
    bevelSize: 0.2,
    bevelOffset: 0,
    bevelSegments: 5,
  };

  const geometry = new THREE.ExtrudeGeometry(shape, extrudeSettings);

  // 定义材质,这里我们用了 MeshPhysicalMaterial
  const materials = {
    top: new THREE.MeshPhysicalMaterial({
      color: 0xffffff,
      metalness: 0.2,
      roughness: 0.1,
      transmission: 0.9,
      thickness: 0.5,
      transparent: true,
      opacity: 0.3,
      side: THREE.DoubleSide,
      envMapIntensity: 1,
      clearcoat: 1.0,
      clearcoatRoughness: 0.1,
    }),
  };

  const mesh = new THREE.Mesh(geometry, materials.top);

  // 给挤压后的形状边缘添加发光效果
  const edges = new THREE.EdgesGeometry(geometry);
  const line = new THREE.LineSegments(
    edges,
    new THREE.LineBasicMaterial({
      color: 0x00ffff,
      transparent: true,
      opacity: 0.3,
    })
  );
  mesh.add(line);

  return mesh;
}
注意:也可以把材质统一放在一个全局对象里,这里为了方便理解,直接在函数里示例。
加载并解析 GeoJSON 数据
我们通过 fetch 请求加载本地 map.json 文件,然后对每个 Feature 进行处理:
async function loadMapData() {
  const response = await fetch("/map.json");
  const mapData = await response.json();

  // 地图中心点 (北京经纬度为例)
  const centerCoord = [116.4074, 39.9042];
  // 存储所有文字标签,后续在动画循环里更新
  const labels = [];

  // 遍历 GeoJSON 中所有的 Feature
  mapData.features.forEach((feature) => {
    if (feature.geometry.type === "MultiPolygon") {
      const allPoints = [];
      let maxHeight = 0;

      // 每个 MultiPolygon 可能包含多个 polygons
      feature.geometry.coordinates.forEach((polygon) => {
        // polygon 里可能包含多个 ring
        polygon.forEach((ring) => {
          // 把 ring 数组中的坐标转换为 Three.js Vector3
          const points = [];
          ring.forEach((coord) => {
            const [x, y] = convertCoordinates(coord, centerCoord);
            points.push(new THREE.Vector3(x, y, 0));
          });

          // 将所有点合并到 allPoints 用于之后计算中心点
          allPoints.push(...points);

          // 随机给它一个高度,也可以改为根据实际数据设置
          const height = 1 + Math.random() * 0.5;
          maxHeight = Math.max(maxHeight, height);

          // 创建挤压形状并添加到场景
          const extrudedMesh = createExtrudedShape(points, height);
          scene.add(extrudedMesh);

          // 创建多边形上边的边框线
          const lineGeometry = new THREE.BufferGeometry().setFromPoints([
            ...points,
            points[0], // 收回到起点
          ]);
          const lineMaterial = new THREE.LineBasicMaterial({
            color: 0x00ffff,
            transparent: true,
            opacity: 0.5,
          });
          const line = new THREE.Line(lineGeometry, lineMaterial);
          line.position.setZ(height);
          scene.add(line);

          // 创建挤压形状侧面的垂直边框
          points.forEach((point, i) => {
            const verticalLineGeometry = new THREE.BufferGeometry().setFromPoints([
              point,
              new THREE.Vector3(point.x, point.y, height),
            ]);
            const verticalLine = new THREE.Line(verticalLineGeometry, lineMaterial);
            scene.add(verticalLine);
          });
        });
      });

      // 创建标签(在多边形最高点附近)
      const center = calculatePolygonCenter(allPoints);
      const label = createLabel(feature.properties.name, {
        x: center.x,
        y: center.y,
        z: maxHeight + 0.5,
      });
      labels.push(label);
      scene.add(label);
    }
  });

  // 动画循环
  function animate() {
    requestAnimationFrame(animate);

    // 更新 OrbitControls
    controls.update();

    // 更新所有标签(根据距离动态缩放)
    labels.forEach((label) => label.update());

    // 渲染场景(WebGL + CSS2D)
    renderer.render(scene, camera);
    labelRenderer.render(scene, camera);
  }

  animate();
}

// 最后别忘了调用函数
loadMapData();
通过以上步骤,我们就能加载 map.json 中的坐标,将其挤压成 3D 形状,并给每个区域顶部添加文字标签。
自适应窗口大小
我们通常会添加一个监听器,用于在浏览器窗口大小变化时,自动调整相机的宽高比和渲染器的大小:
window.addEventListener("resize", () => {
  camera.aspect = window.innerWidth / window.innerHeight;
  camera.updateProjectionMatrix();
  renderer.setSize(window.innerWidth, window.innerHeight);
  labelRenderer.setSize(window.innerWidth, window.innerHeight);
});
这样就能保证 3D 场景在各种屏幕尺寸下都能正常显示。
总结
通过以上步骤,你就能在 Three.js 场景中可视化一个简易的 3D 地图:
- 使用
fetch加载本地或服务器上的 GeoJSON 数据。 - 将经纬度转换为场景坐标并生成
THREE.Shape。 - 使用
THREE.ExtrudeGeometry将二维多边形挤压为三维模型。 - 用 CSS2DRenderer 让文字标签能稳定地跟随模型。
- 添加 OrbitControls,用户可以交互式地查看和操作 3D 地图。
代码
https://github.com/calmound/threejs-demo/tree/main/geojson (opens in a new tab)