不用 Cesium,Three.js 也能做 3D 地球可视化
最近用世界地图的 GeoJSON 数据 + Three.js 做了几个地球可视化效果:人口柱体地球、线框星空地球、粒子世界。
核心思路是一样的——把经纬度坐标先在平面上处理,再"弯曲"贴到球面。搞清楚这一步,三个效果都能套用。
GeoJSON 是什么
GeoJSON 是一种描述地理数据的 JSON 格式,世界各国的边界、行政区划、城市坐标都可以用它来表示。
一份典型的世界地图 GeoJSON 大概长这样:
{
  "type": "FeatureCollection",
  "features": [{
    "properties": {
      "name": "China",
      "pop_est": 1402112000
    },
    "geometry": {
      "type": "Polygon",
      "coordinates": [[[lng, lat], [lng, lat], ...]]
    }
  }]
}
每个国家是一个 feature,properties 存属性数据(人口、GDP 等),geometry 存边界坐标。边界就是一堆经纬度点围成的多边形。
怎么把 GeoJSON 变成 Three.js 几何体
这是整个项目最关键的部分。
加载数据
用 fetch 直接读 JSON 文件,然后遍历每个 feature:
const response = await fetch('world.geojson');
const data = await response.json();

for (const feature of data.features) {
    const meshes = createCountry(feature, radius);
    meshes.forEach(mesh => scene.add(mesh));
}
从坐标创建 THREE.Shape
THREE.Shape 是 Three.js 里的二维形状,支持内嵌空洞(比如南非包裹着莱索托)。
GeoJSON 里国家边界分两种类型:
Polygon:普通国家,单块领土MultiPolygon:岛国或有飞地的国家(日本、印尼等),多块领土
function createCountryShapes(geometry) {
    const shapes = [];

    const processPolygon = (polygonCoords) => {
        const shape = new THREE.Shape();
        // 外部轮廓
        const outerPts = polygonCoords[0].map(p => new THREE.Vector2(p[0], p[1]));
        shape.setFromPoints(outerPts);
        // 内部空洞
        for (let i = 1; i < polygonCoords.length; i++) {
            const hole = new THREE.Path();
            hole.setFromPoints(polygonCoords[i].map(p => new THREE.Vector2(p[0], p[1])));
            shape.holes.push(hole);
        }
        return shape;
    };

    if (geometry.type === 'Polygon') {
        shapes.push(processPolygon(geometry.coordinates));
    } else if (geometry.type === 'MultiPolygon') {
        geometry.coordinates.forEach(polygonCoords => {
            shapes.push(processPolygon(polygonCoords));
        });
    }

    return shapes;
}
这里的坐标 [lng, lat] 被当成二维平面的 [x, y] 存进 Shape,还没有投影到球面。
ExtrudeGeometry 拉伸成 3D,再"弯曲"贴到球面
这是整个方案最巧妙的地方。
直觉上可能先想把经纬度转成 3D 坐标再建网格,但构建三角网格很麻烦。实际做法反过来:先在平面建形状、拉伸,再把每个顶点"掰弯"到球面上。
// 先在平面拉伸
const geometry = new THREE.ExtrudeGeometry(shape, {
    depth: height,
    bevelEnabled: false
});

// 再把每个顶点从平面坐标转换到球面坐标
const positions = geometry.attributes.position;
for (let i = 0; i < positions.count; i++) {
    const lng = positions.getX(i);  // 平面 x = 经度
    const lat = positions.getY(i);  // 平面 y = 纬度
    const h   = positions.getZ(i);  // 平面 z = 拉伸高度(0~depth)

    const pos = latLngToVec3(lat, lng, radius + h);
    positions.setXYZ(i, pos.x, pos.y, pos.z);
}

// 弯曲后法线失效,必须重新计算
geometry.computeVertexNormals();
弯曲之后,平面形状自然贴合到球面,拉伸方向也变成了径向朝外。
坐标转换公式
球坐标系转笛卡尔,高中数学:
function latLngToVec3(lat, lng, radius) {
    const phi   = (90 - lat) * (Math.PI / 180);
    const theta = (lng + 180) * (Math.PI / 180);

    return new THREE.Vector3(
        -radius * Math.sin(phi) * Math.cos(theta),
         radius * Math.cos(phi),
         radius * Math.sin(phi) * Math.sin(theta)
    );
}
纬度决定 Y 轴高度,经度决定 XZ 平面方向,乘以半径就是球面上的点。
案例一:3D 人口地球
每个国家根据人口拉伸成不同高度的柱体。
人口跨度从 10 万到 14 亿,差了 1 万倍,直接按比例大多数国家几乎看不见。用 Math.pow 压缩差距:
const height = Math.pow((pop - minPop) / (maxPop - minPop), 0.4) * 15;指数 0.4 是反复调试后视觉上最均匀的值——0.5 小国还是太矮,0.3 大国之间差异又太小。
颜色也映射人口,用多段渐变做色阶:
const sqrtT = Math.pow(t, 0.35);
const idx = Math.min(Math.floor(sqrtT * 5), 4);
const localT = (sqrtT * 5) - idx;
return colors[idx].clone().lerp(colors[idx + 1], localT);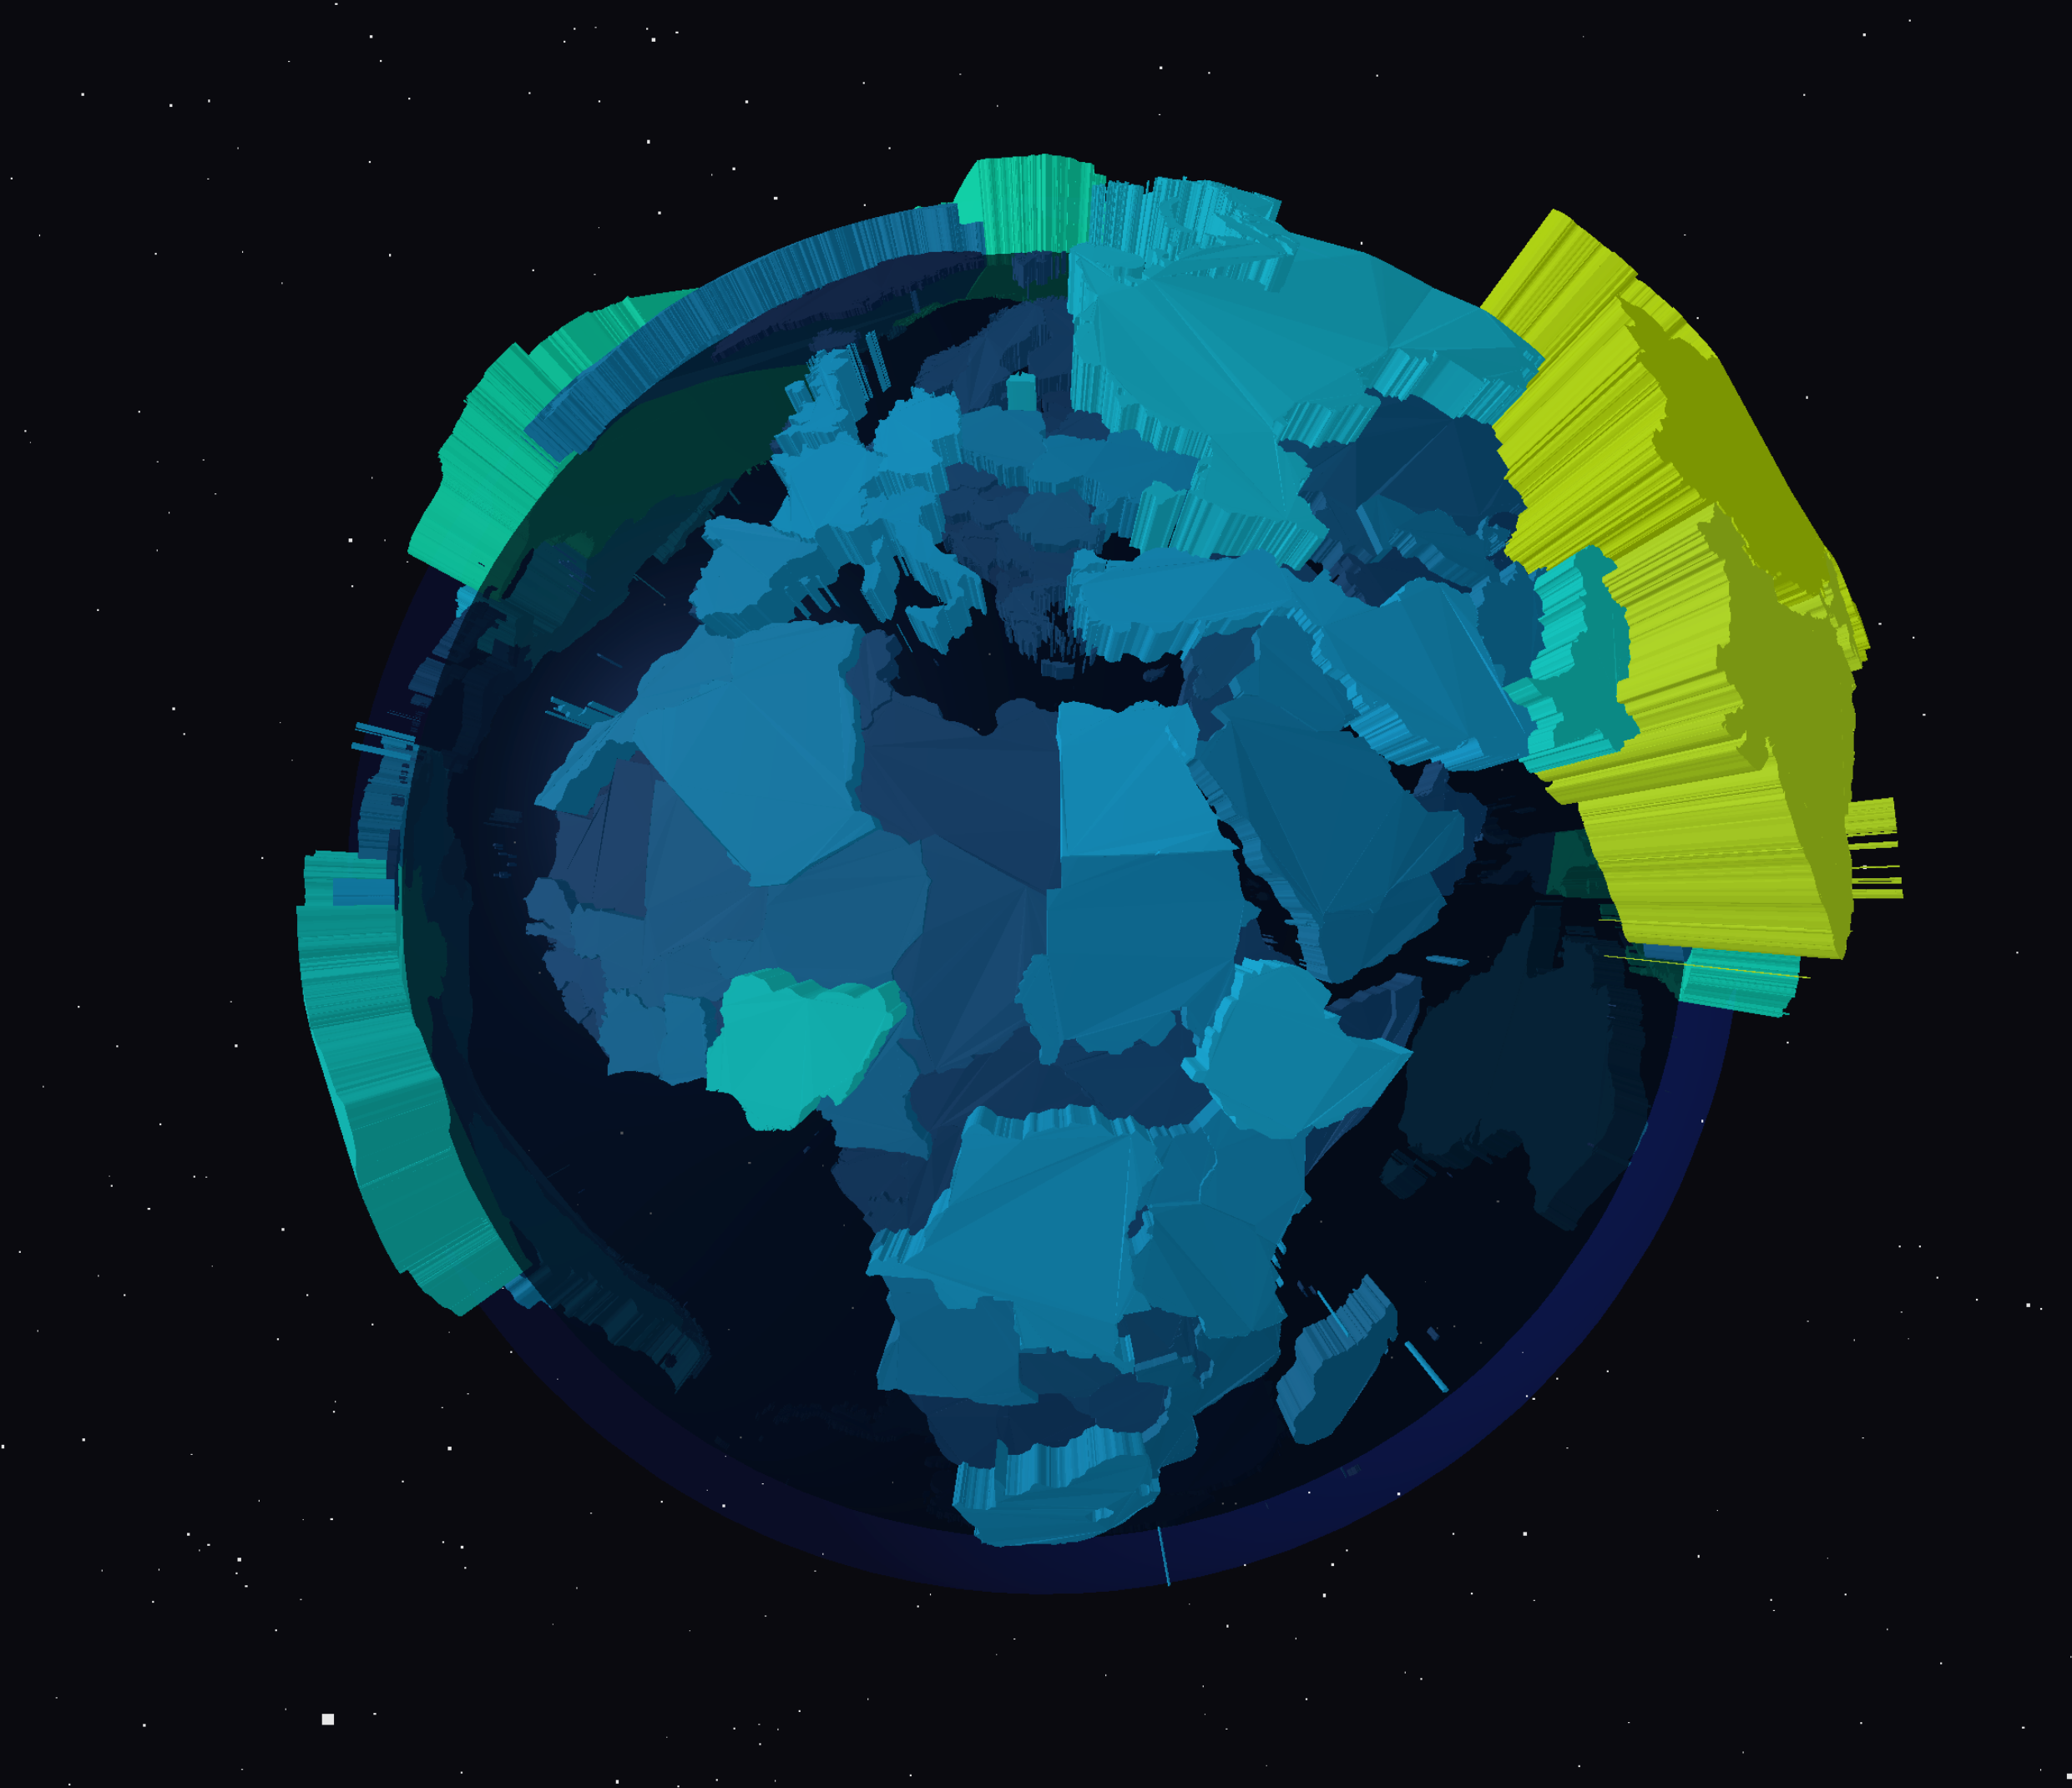
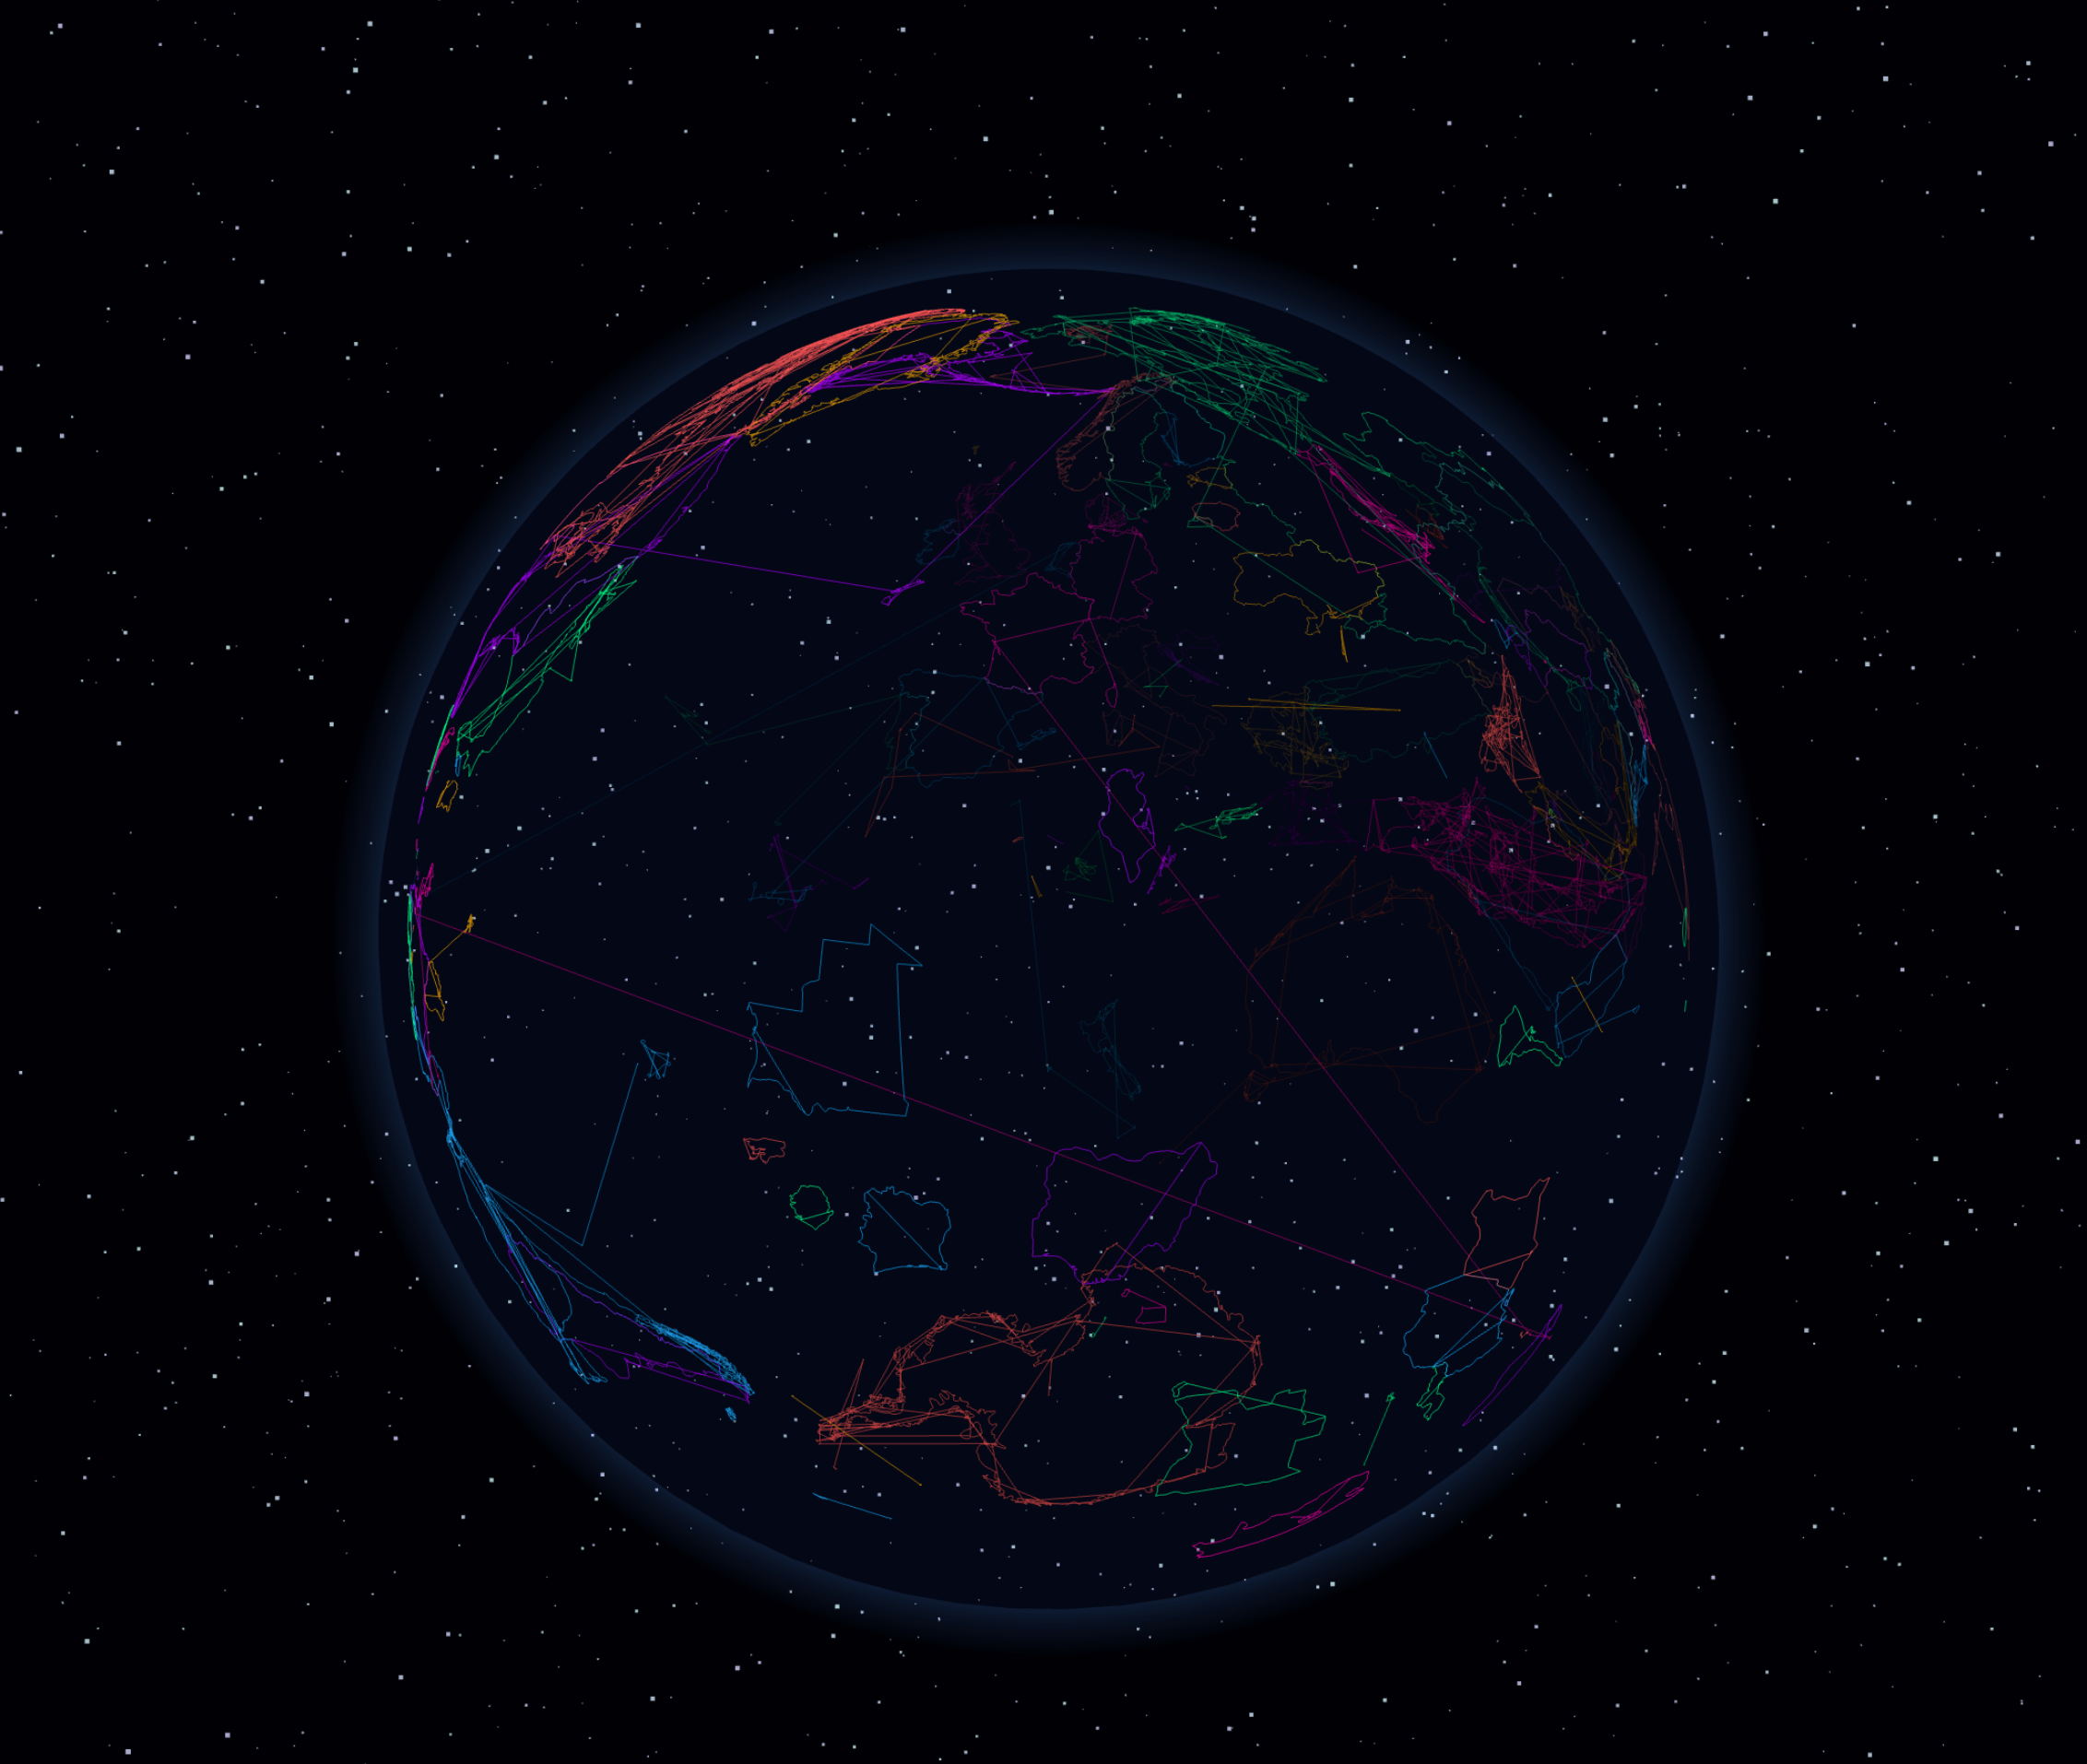
案例二:线框地球 + 星空
换一种思路——不填充面,只画国家边界线,配上星空和大气层光晕。
边界线用 THREE.Line + LineBasicMaterial,把 GeoJSON 坐标转成球面上的点连线:
function createEarthOutline(coords, radius, color) {
    const points = createCountryPoints(coords, radius);
    const geometry = new THREE.BufferGeometry().setFromPoints(points);
    const material = new THREE.LineBasicMaterial({
        color: color,
        transparent: true,
        opacity: 0.6
    });
    return new THREE.Line(geometry, material);
}
不同国家轮流用不同颜色,动画里每帧用 sin 函数让透明度起伏,边界线像在"呼吸":
countryLines.forEach((line, i) => {
    line.material.opacity = 0.4 + Math.sin(time * 0.002 + i * 0.1) * 0.3;
});
大气层用 ShaderMaterial 实现边缘发光效果——根据法线和视角的夹角控制亮度,越边缘越亮:
fragmentShader: `
    varying vec3 vNormal;
    void main() {
        float intensity = pow(0.7 - dot(vNormal, vec3(0.0, 0.0, 1.0)), 2.0);
        gl_FragColor = vec4(0.3, 0.6, 1.0, 1.0) * intensity;
    }
`
案例三:粒子世界
用 15 万个粒子点"拼"出世界地图,颜色按大洲区分,加上波浪动画。
核心是 THREE.Points + BufferGeometry。BufferGeometry 直接操作底层 Float32Array,性能比普通 Geometry 高很多:
const geometry = new THREE.BufferGeometry();
geometry.setAttribute('position', new THREE.BufferAttribute(positions, 3));
geometry.setAttribute('color', new THREE.BufferAttribute(colors, 3));

const material = new THREE.PointsMaterial({
    size: 1.5,
    vertexColors: true,
    blending: THREE.AdditiveBlending  // 叠加混合,粒子密集处更亮
});
波浪动画每帧更新顶点坐标,sin 函数让粒子上下起伏:
posAttr.array[i3] = originalPositions[i3] + Math.sin(time + i) * 0.5;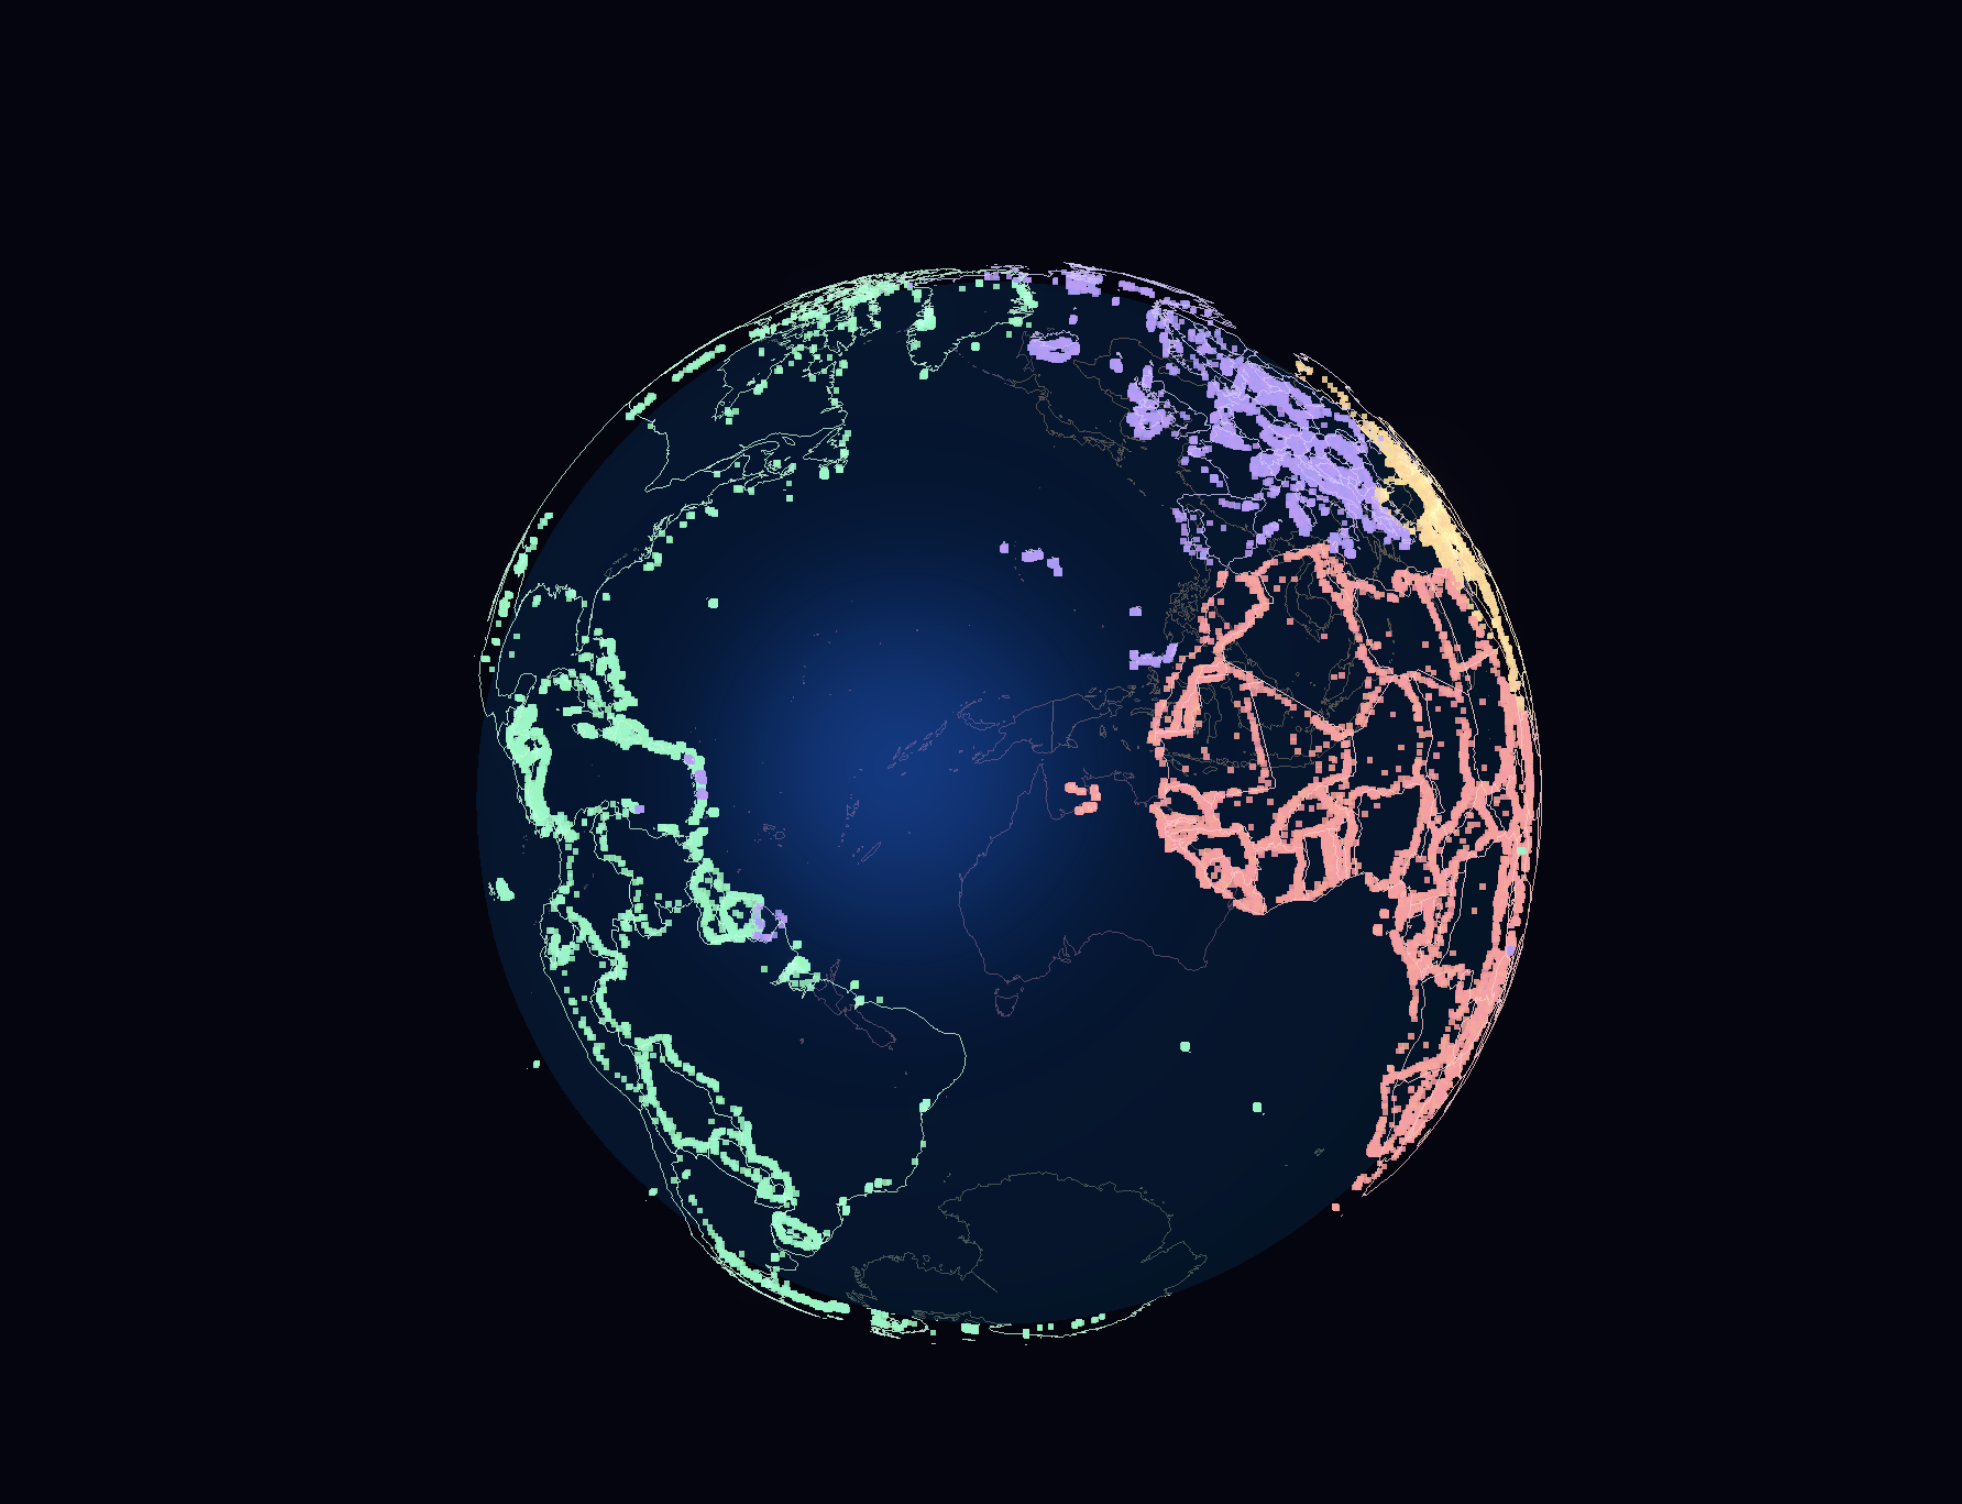
两个加分项
UnrealBloomPass 发光
默认渲染画面偏"平"。加后处理发光,视觉提升明显:
const bloomPass = new UnrealBloomPass(
    new THREE.Vector2(width, height),
    1.5,  // 强度,建议从 0.8 开始调,太大容易过曝
    0.5,  // 扩散范围
    0.2   // 阈值,越低发光范围越广
);
composer.addPass(bloomPass);
OrbitControls 轨道控制
拖拽旋转、滚轮缩放、惯性阻尼:
const controls = new OrbitControls(camera, renderer.domElement);
controls.enableDamping = true;
controls.dampingFactor = 0.05;
开启 enableDamping 后,松手地球会缓缓减速停下,体验好很多。
总结
三个案例用的是同一份 GeoJSON 数据,改变的只是渲染方式:挤出填充体、线条、粒子点。
地理可视化有意思的地方就在这——数据是死的,表现形式可以差很多。GeoJSON 里还有 GDP、碳排放等字段,换个映射逻辑就是另一个效果,有兴趣可以自己接着玩。